Catalyst SD-WAN Troubleshooting Overview
The adoption of multi-cloud applications is driving demand for SD-WAN and DIA (Direct Internet Access). At the same time, network/IT admins face increased visibility and monitoring challenges for critical business applications. Lack of insights results in delays in pinpointing, hence increased OpEx.
Cisco Catalyst comes with embedded capabilities for proactive operation of an SD-WAN fabric. In this section, you will explore one of them, which is called Network Wide Path Insights tool.
Review a Network Wide Path Insights (NWPI) Test
Network-wide Path Insight, or simply NWPI, provides end-to-end application-tracing serviceability in a Cisco Catalyst SD-WAN network. This feature allows you to initiate application tracing and displays the trace results collected from multiple devices in a consolidated view.
You can also view detailed information at the packet level, application level, domain level, flow level, and network level that can provide comprehensive insights into the operations of your network and assist with performance analysis, planning, and troubleshooting.
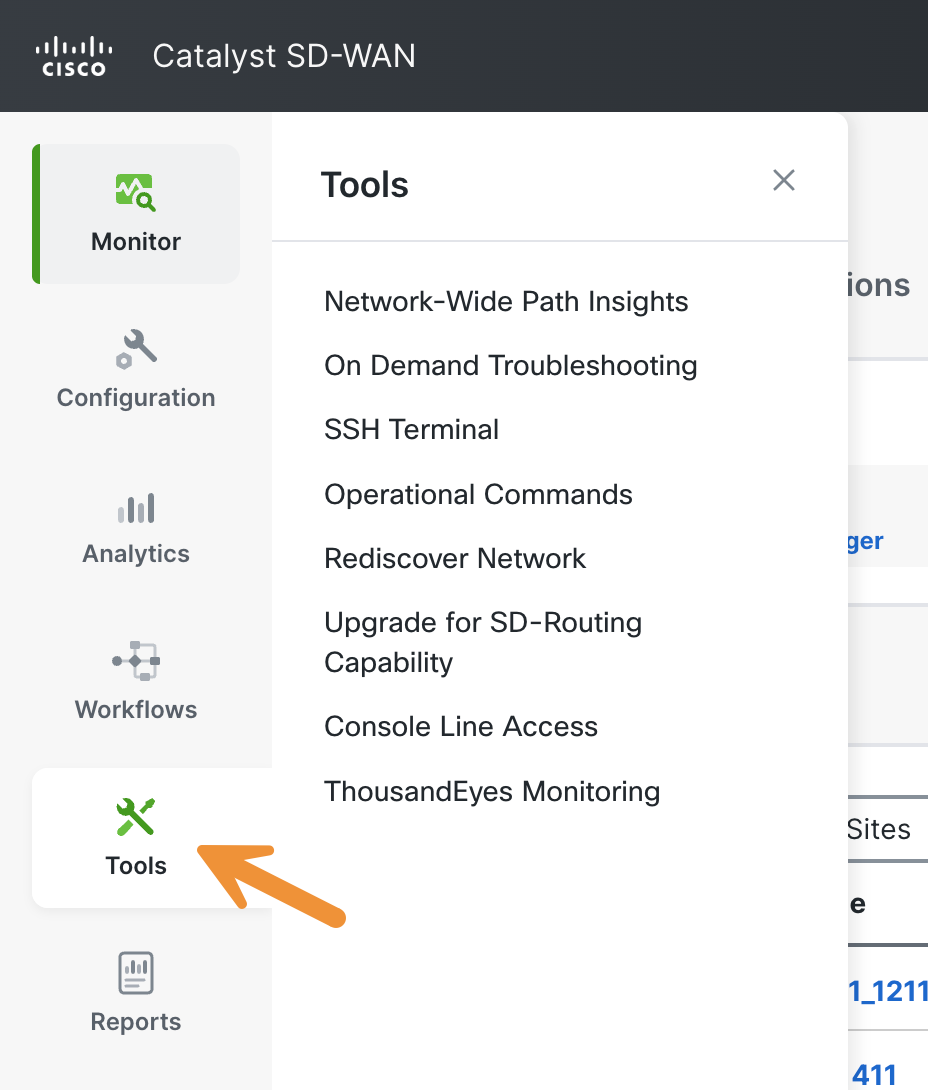
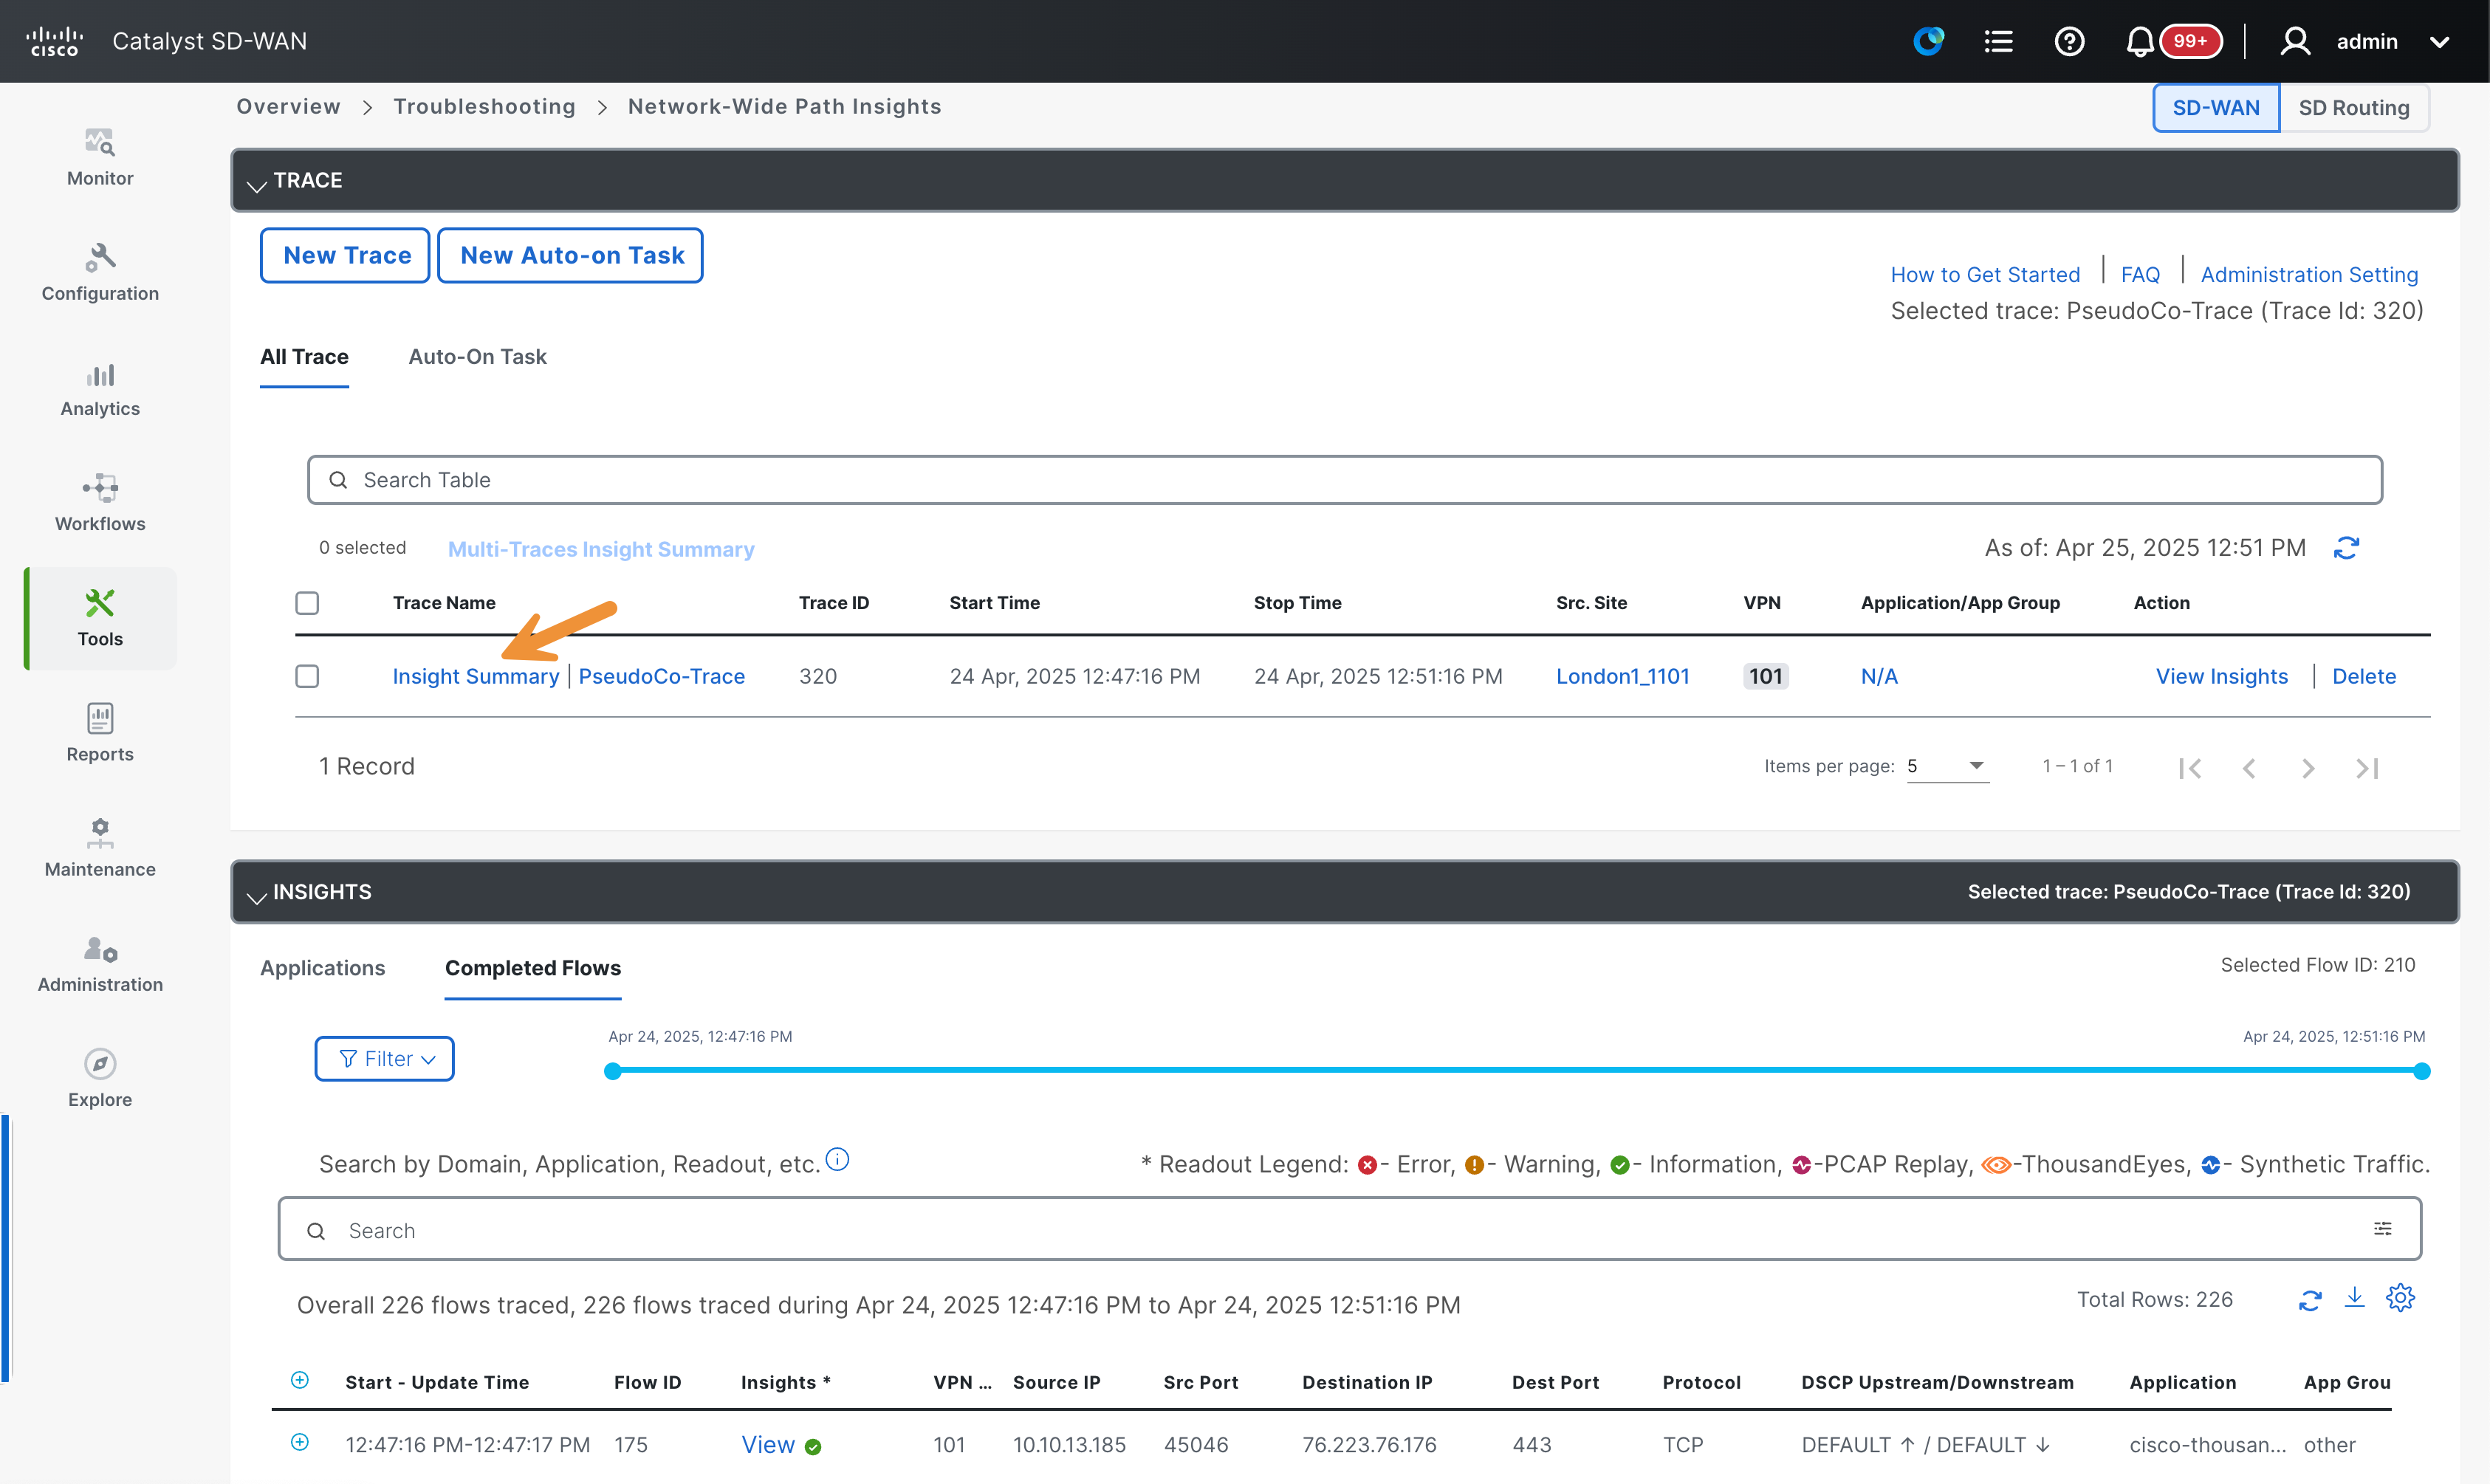
Begin by navigating to Tools > Network Wide Path Insight.
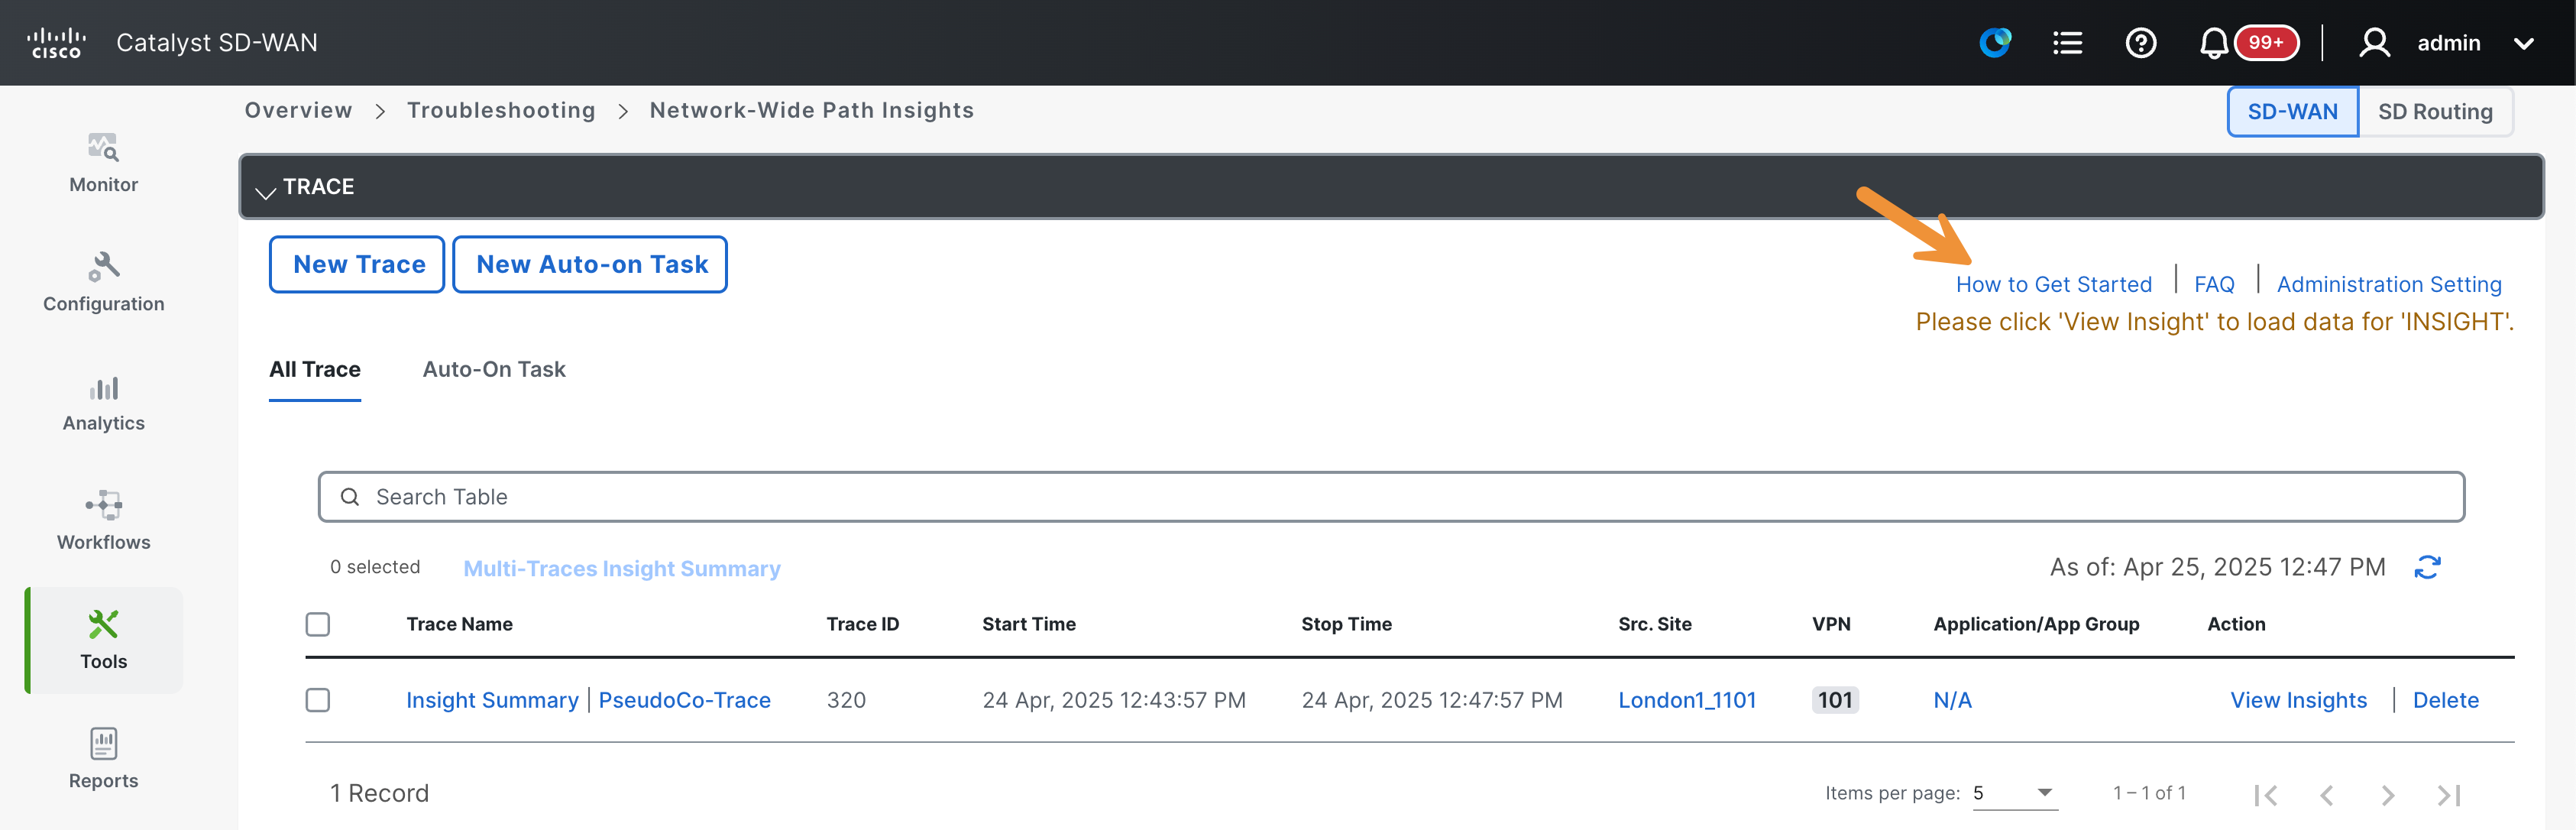
First, click on the blue How to Get Started link located near the top right corner of the screen.
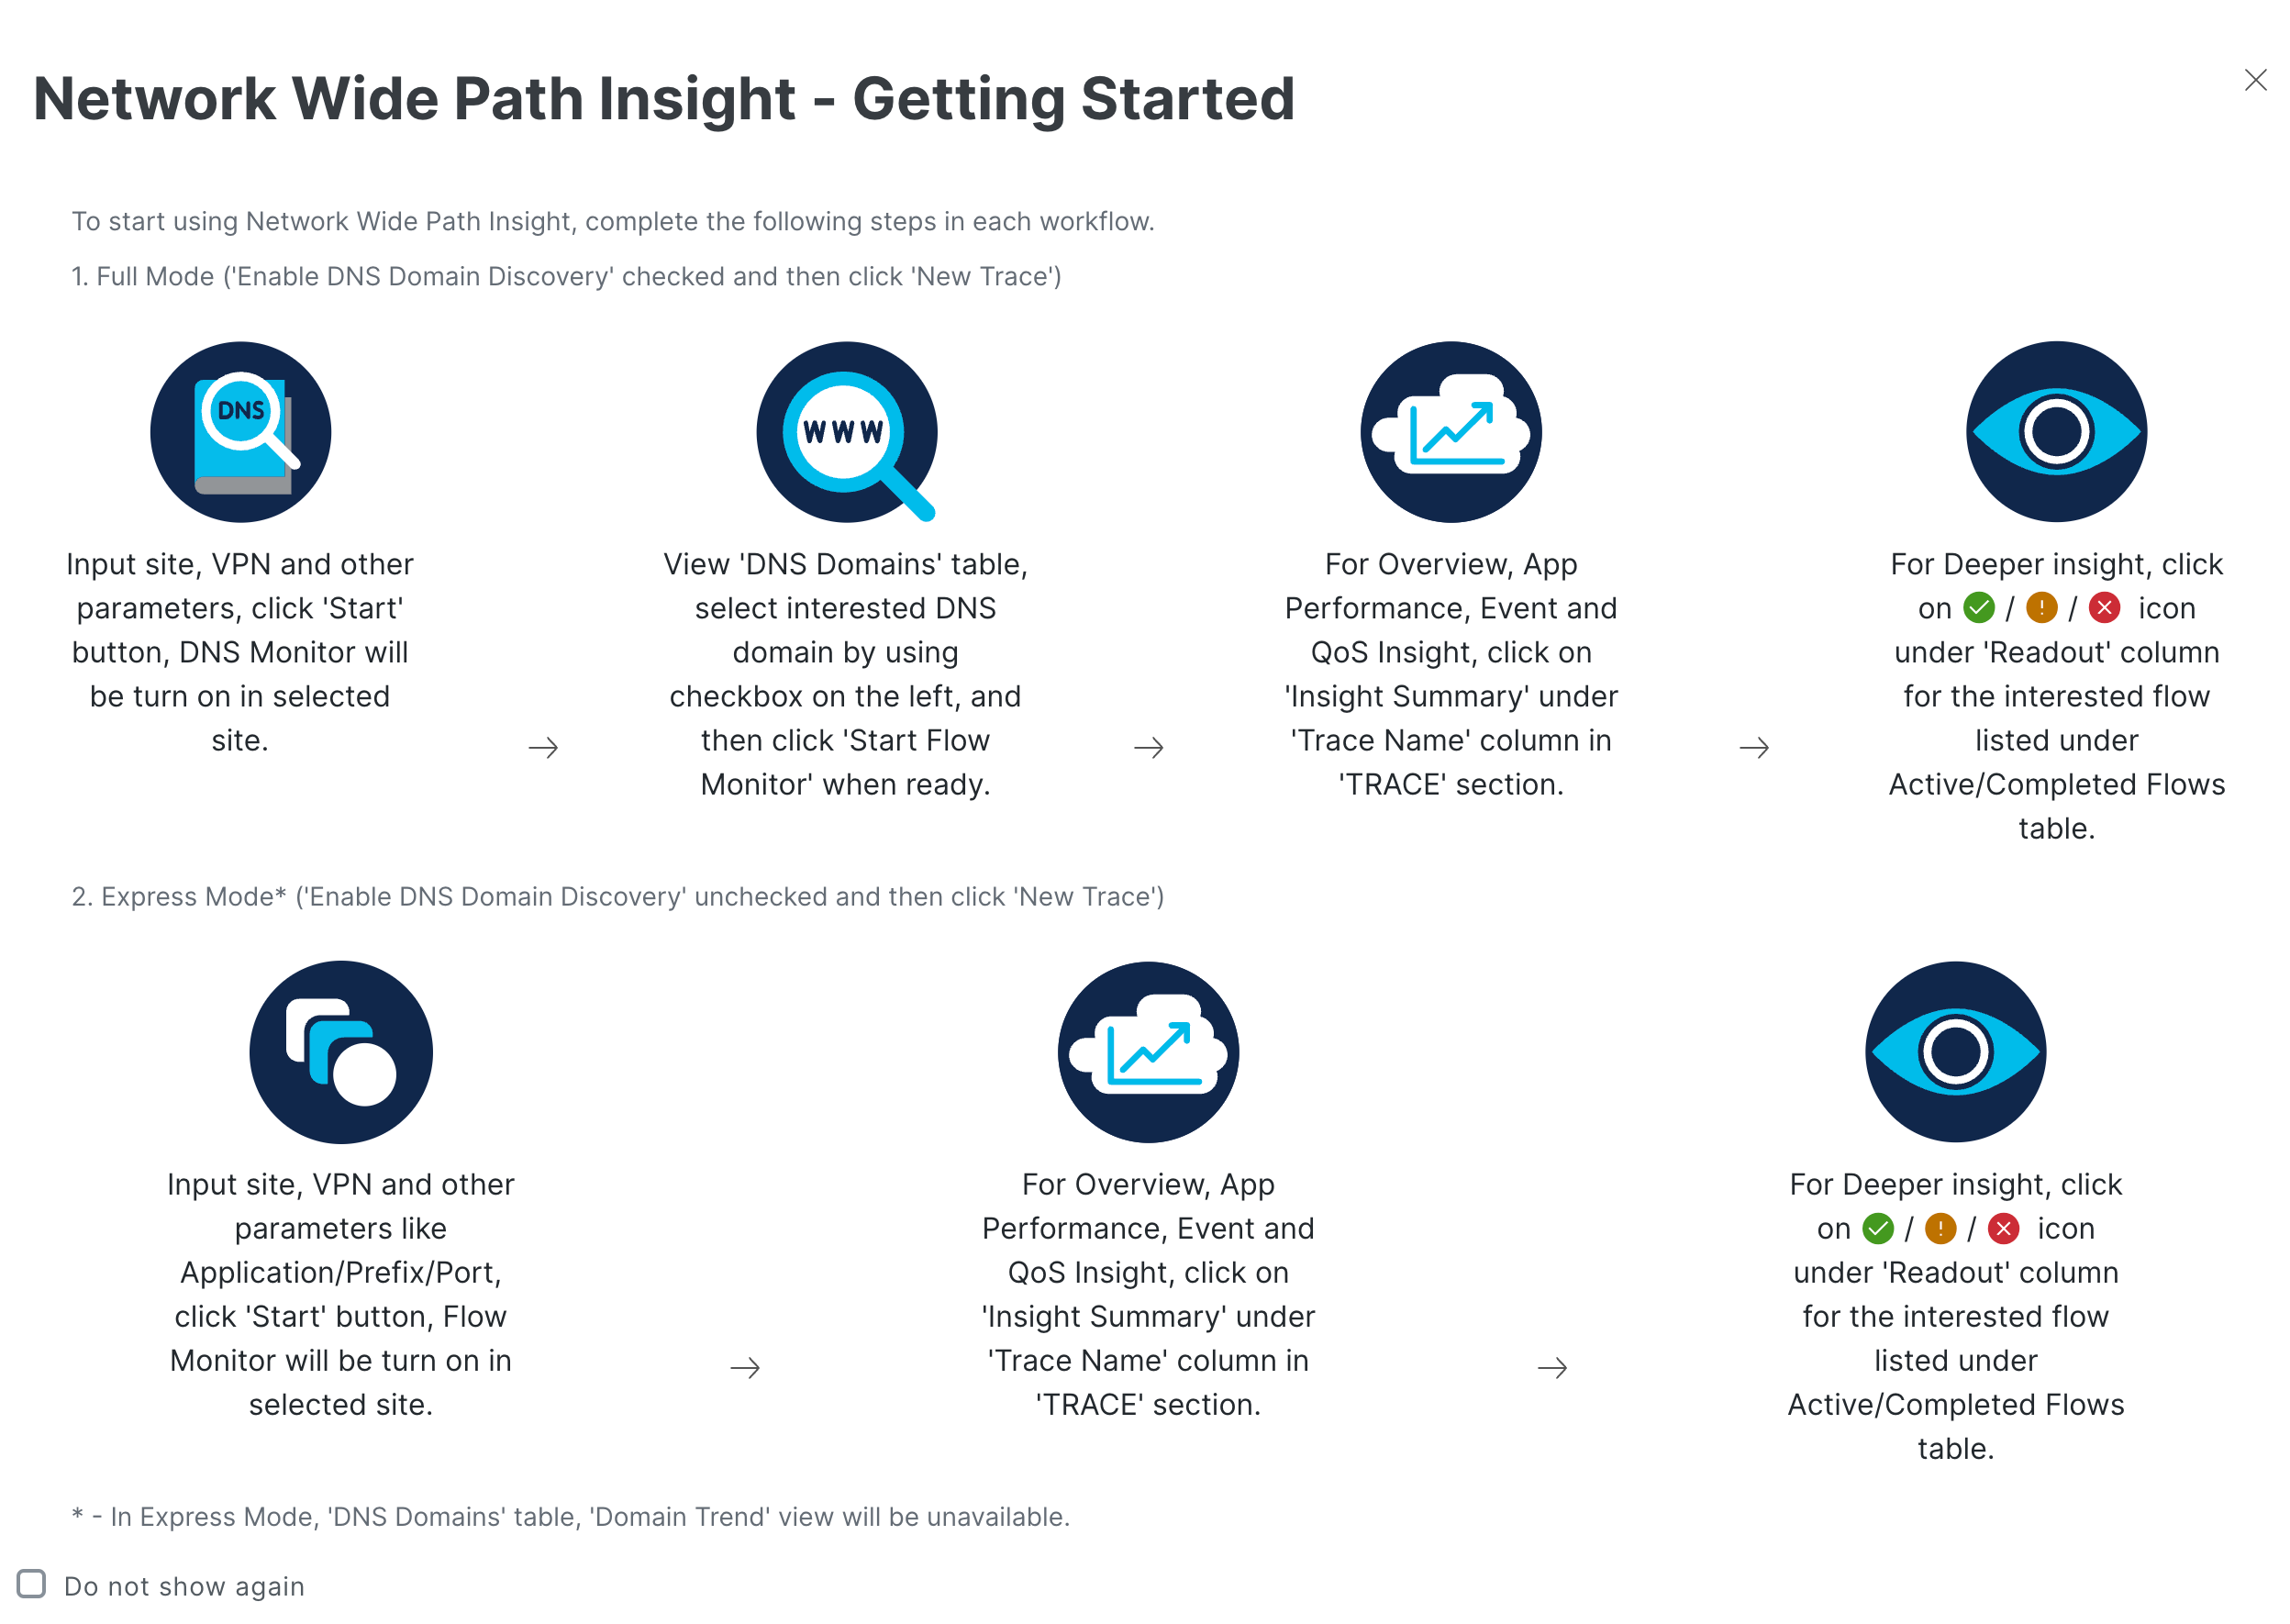
A pop-up will appear. Review the steps provided before proceeding. After that, click on the small gray X at the top right corner.
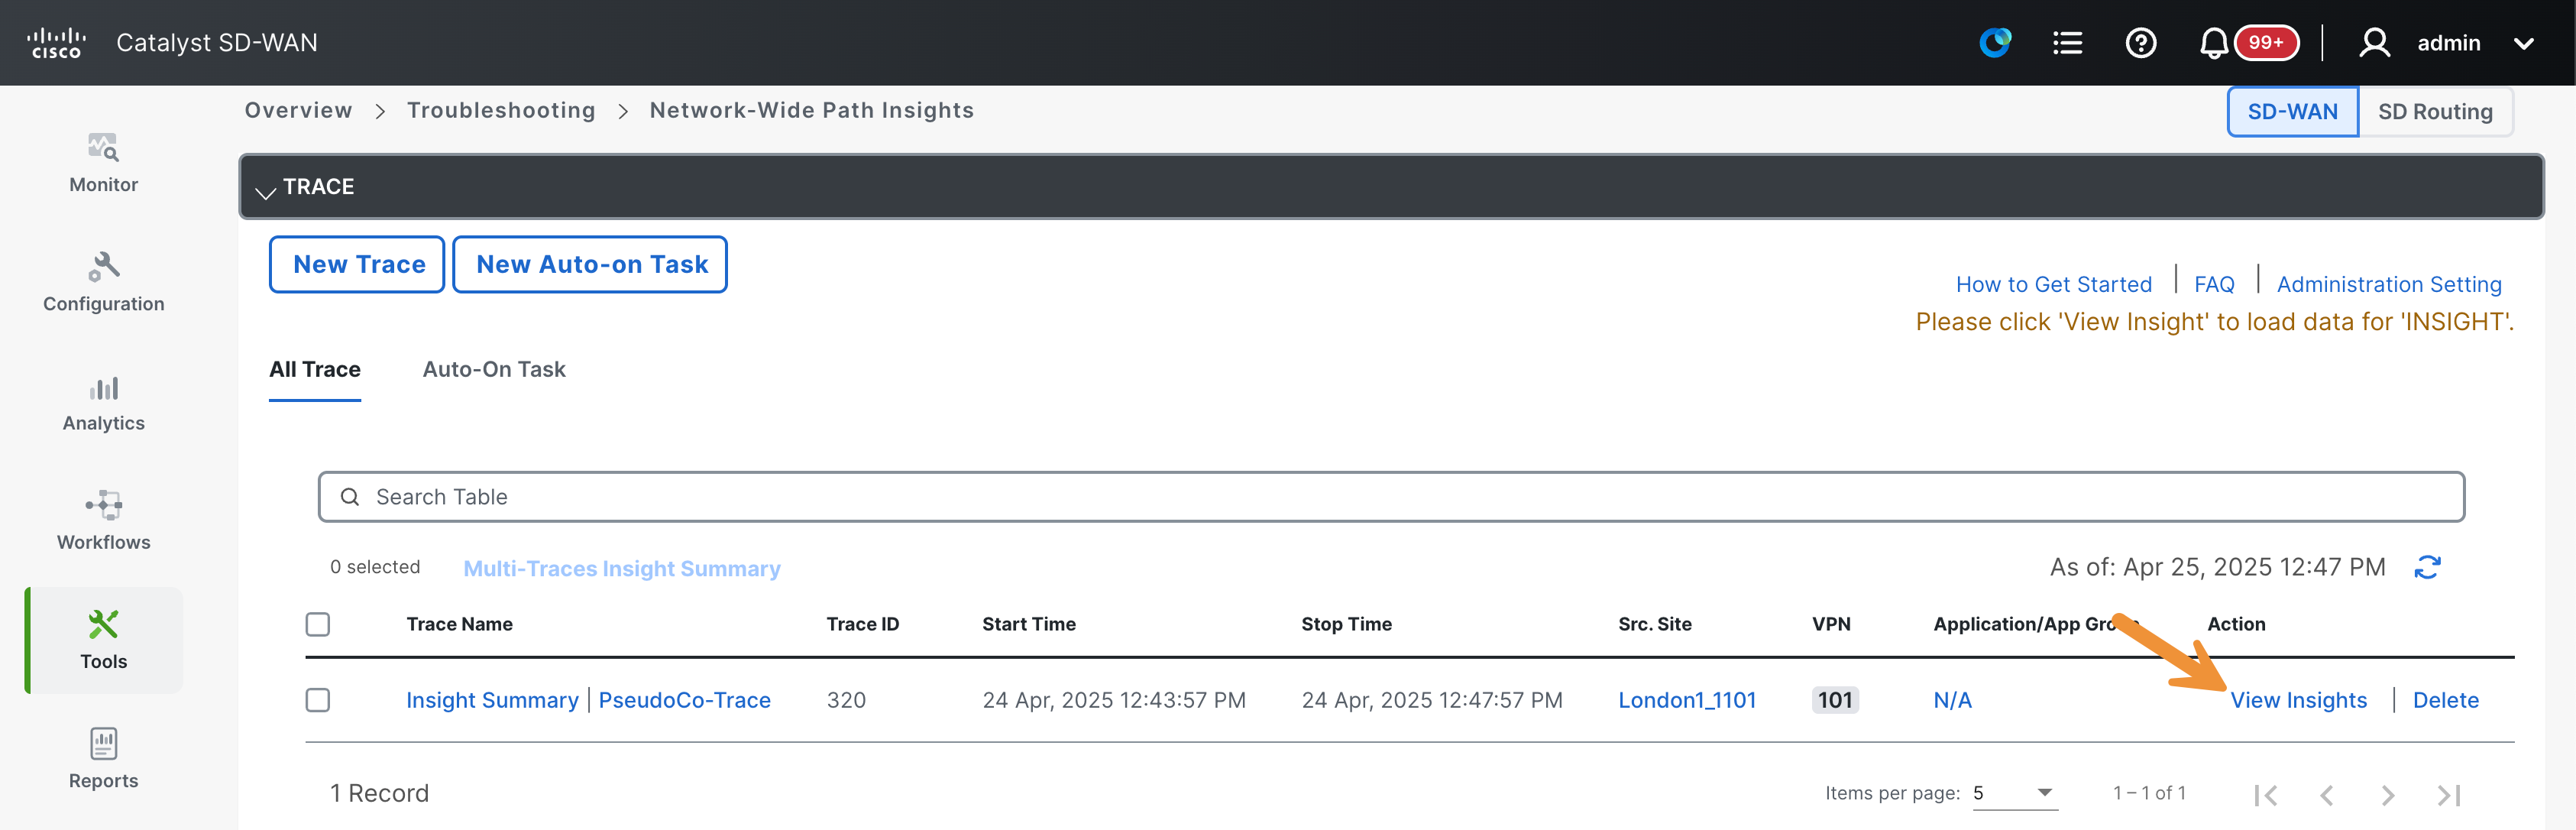
Click on View Insights button found under the Action column to expand details for the PseudoCo-Trace.
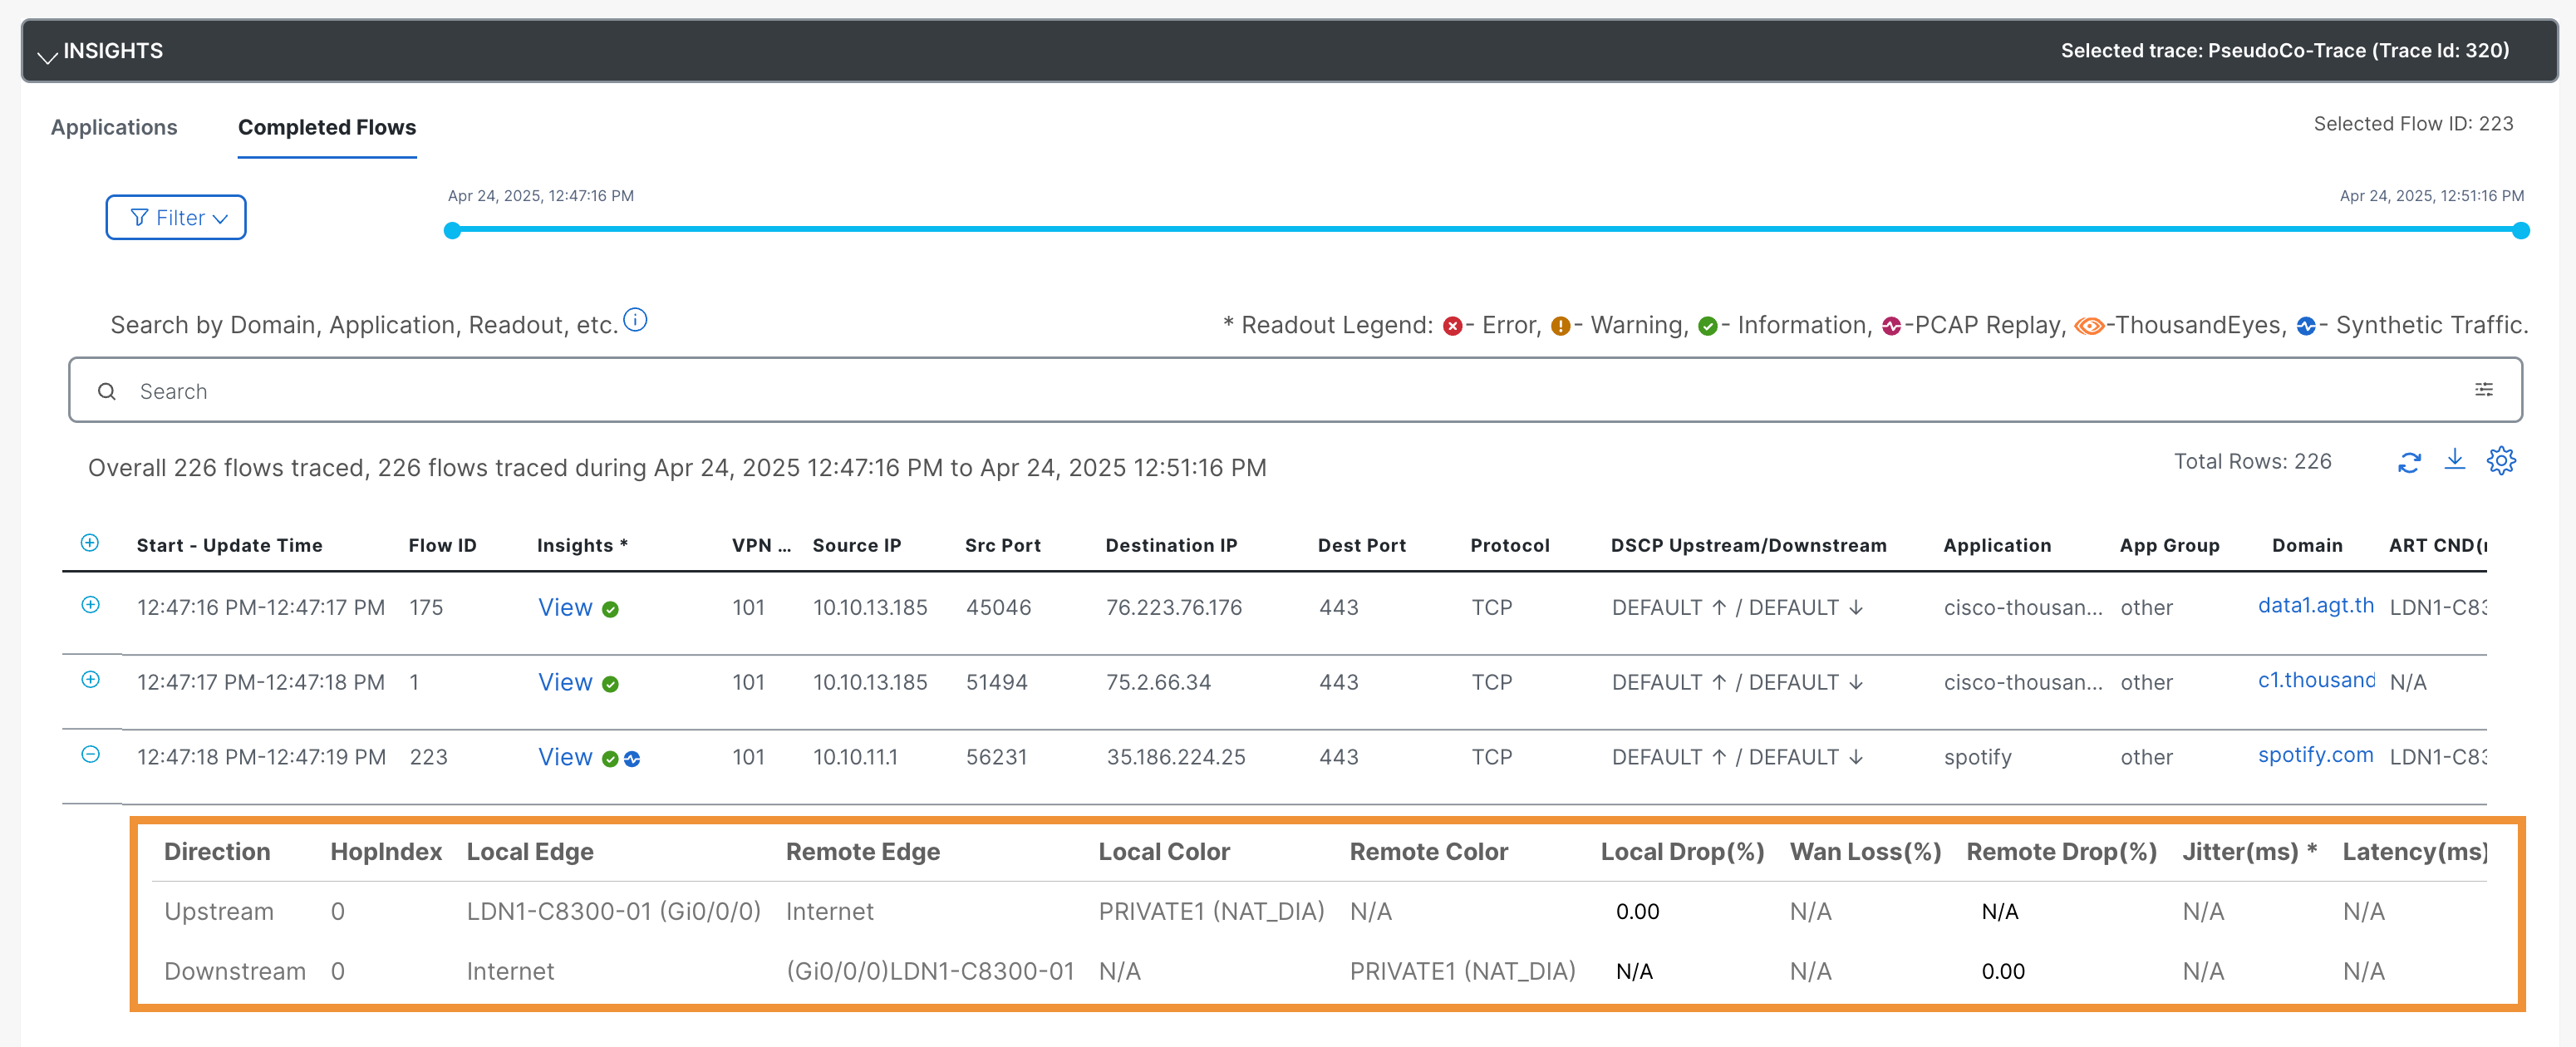
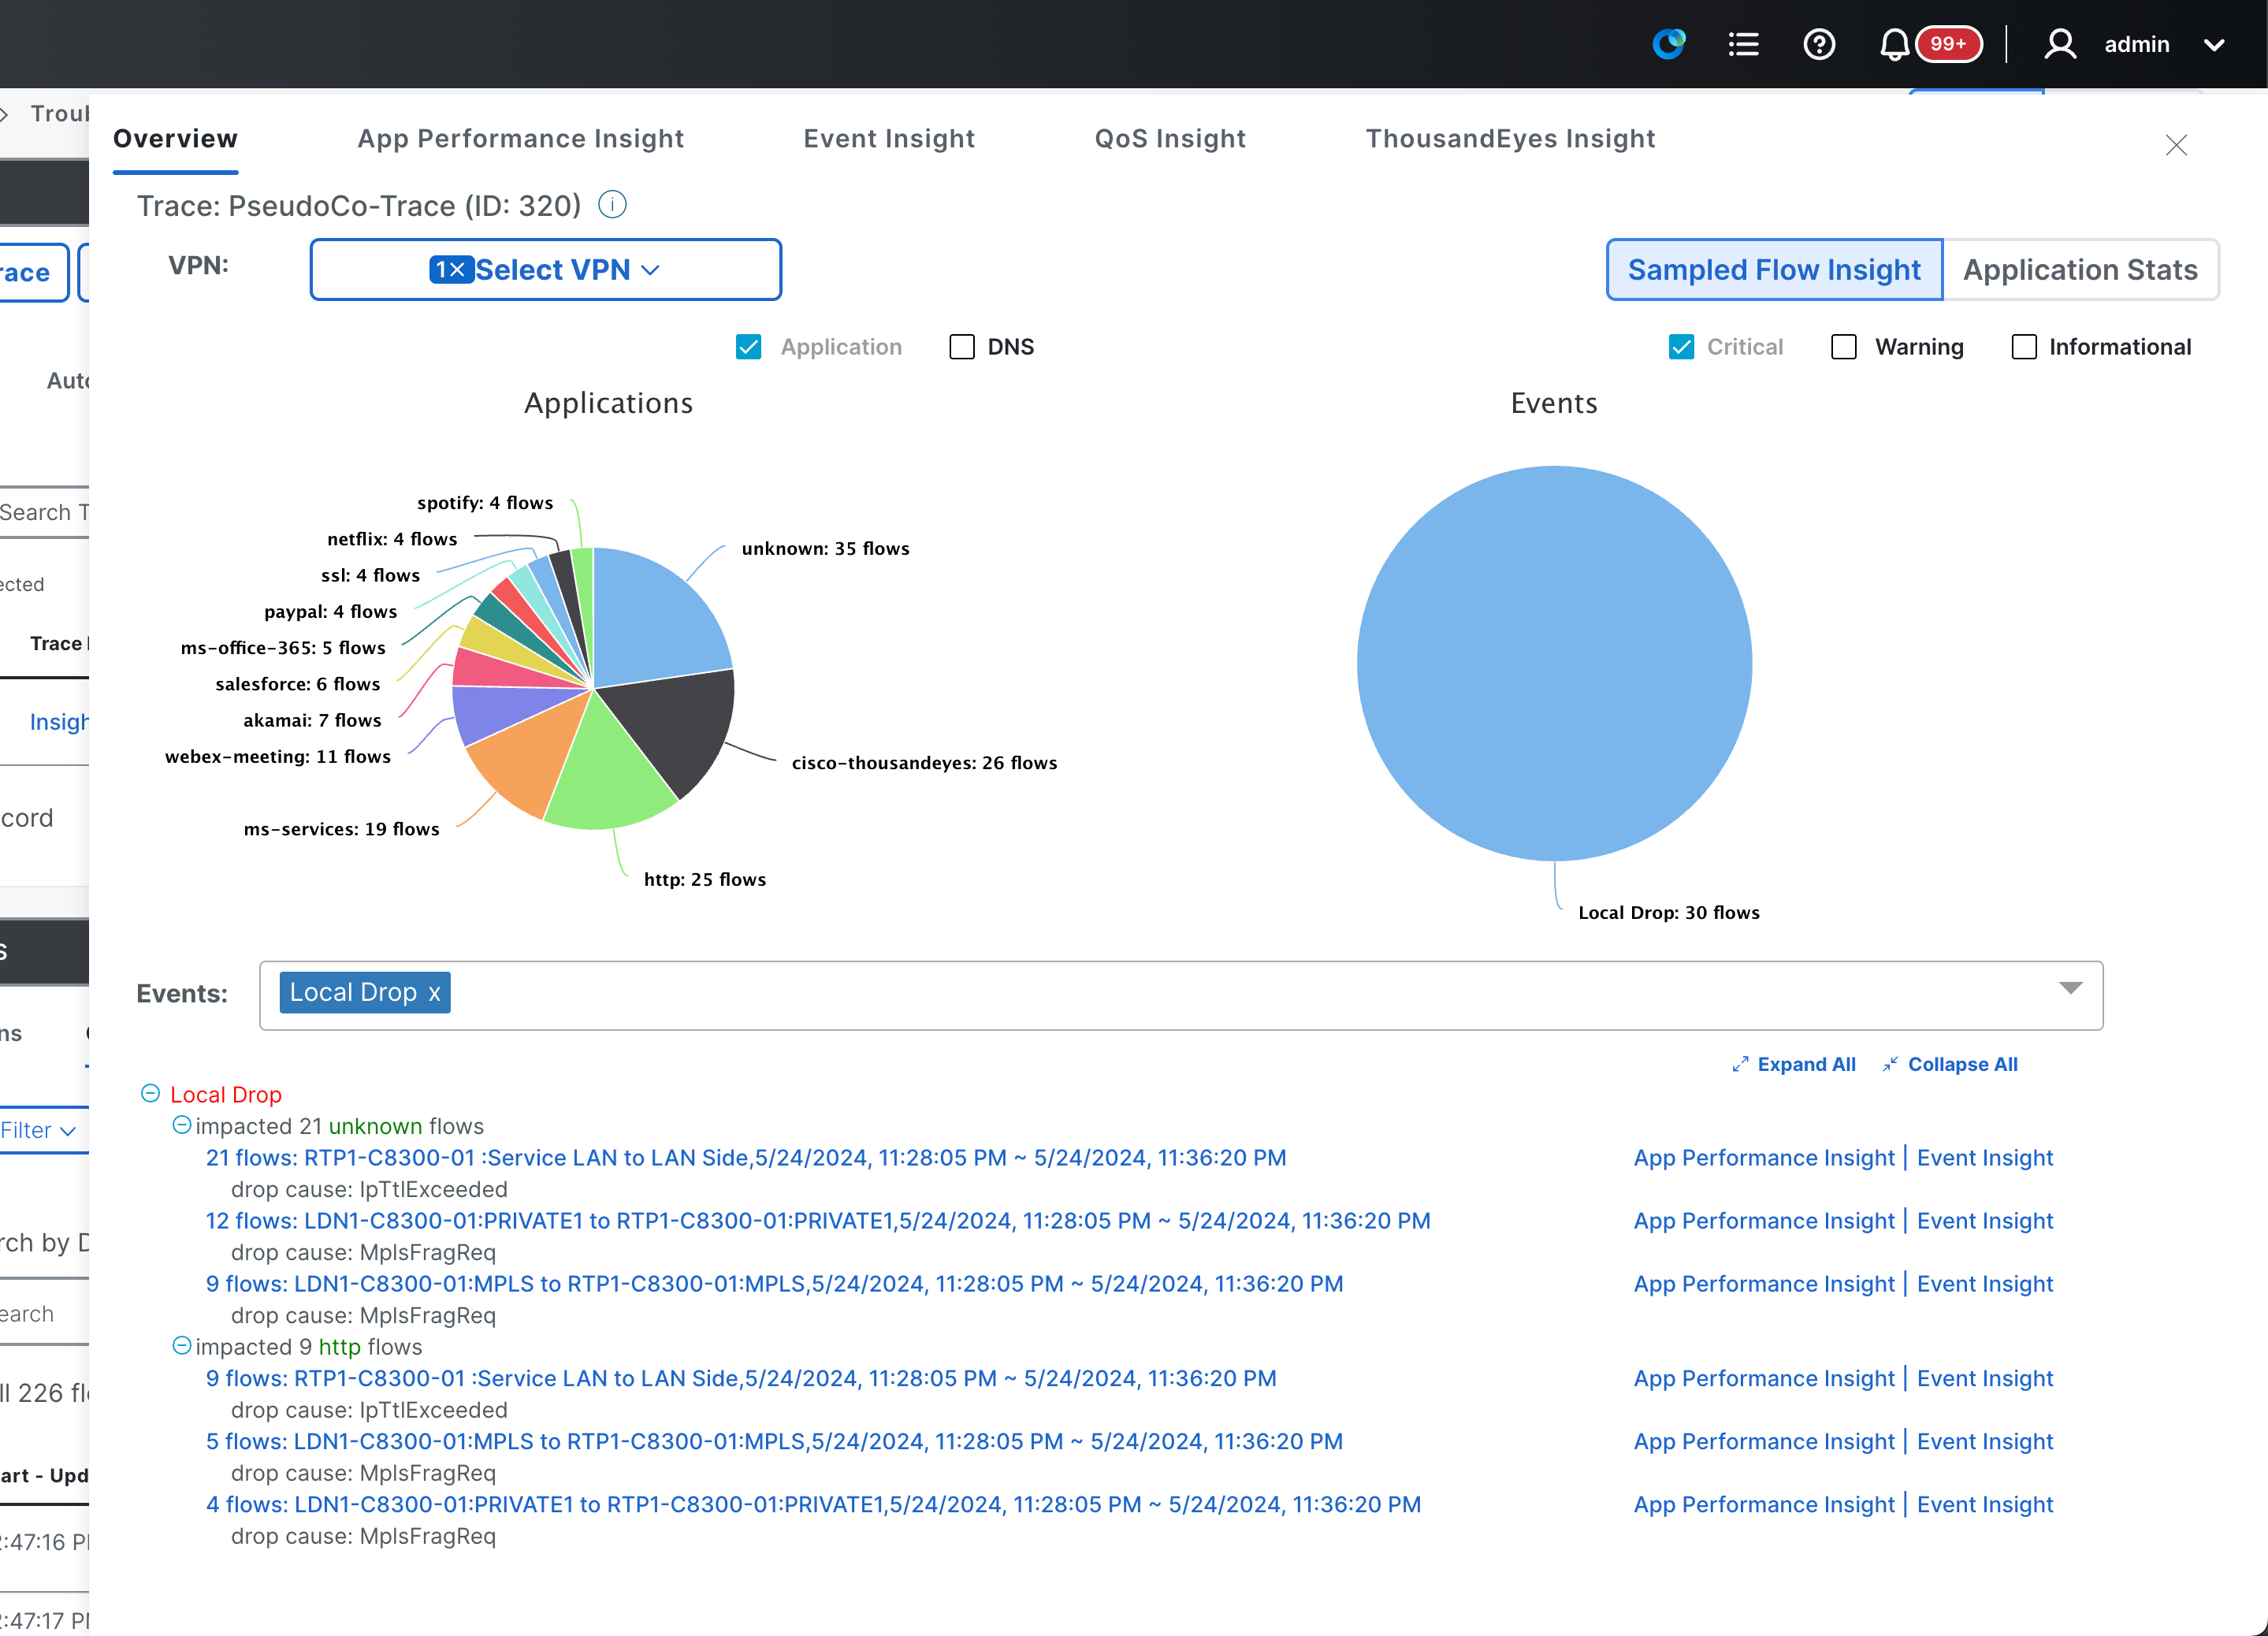
Select a flow from the Insight section and click on the + sign to expand the information about the spotify flow.
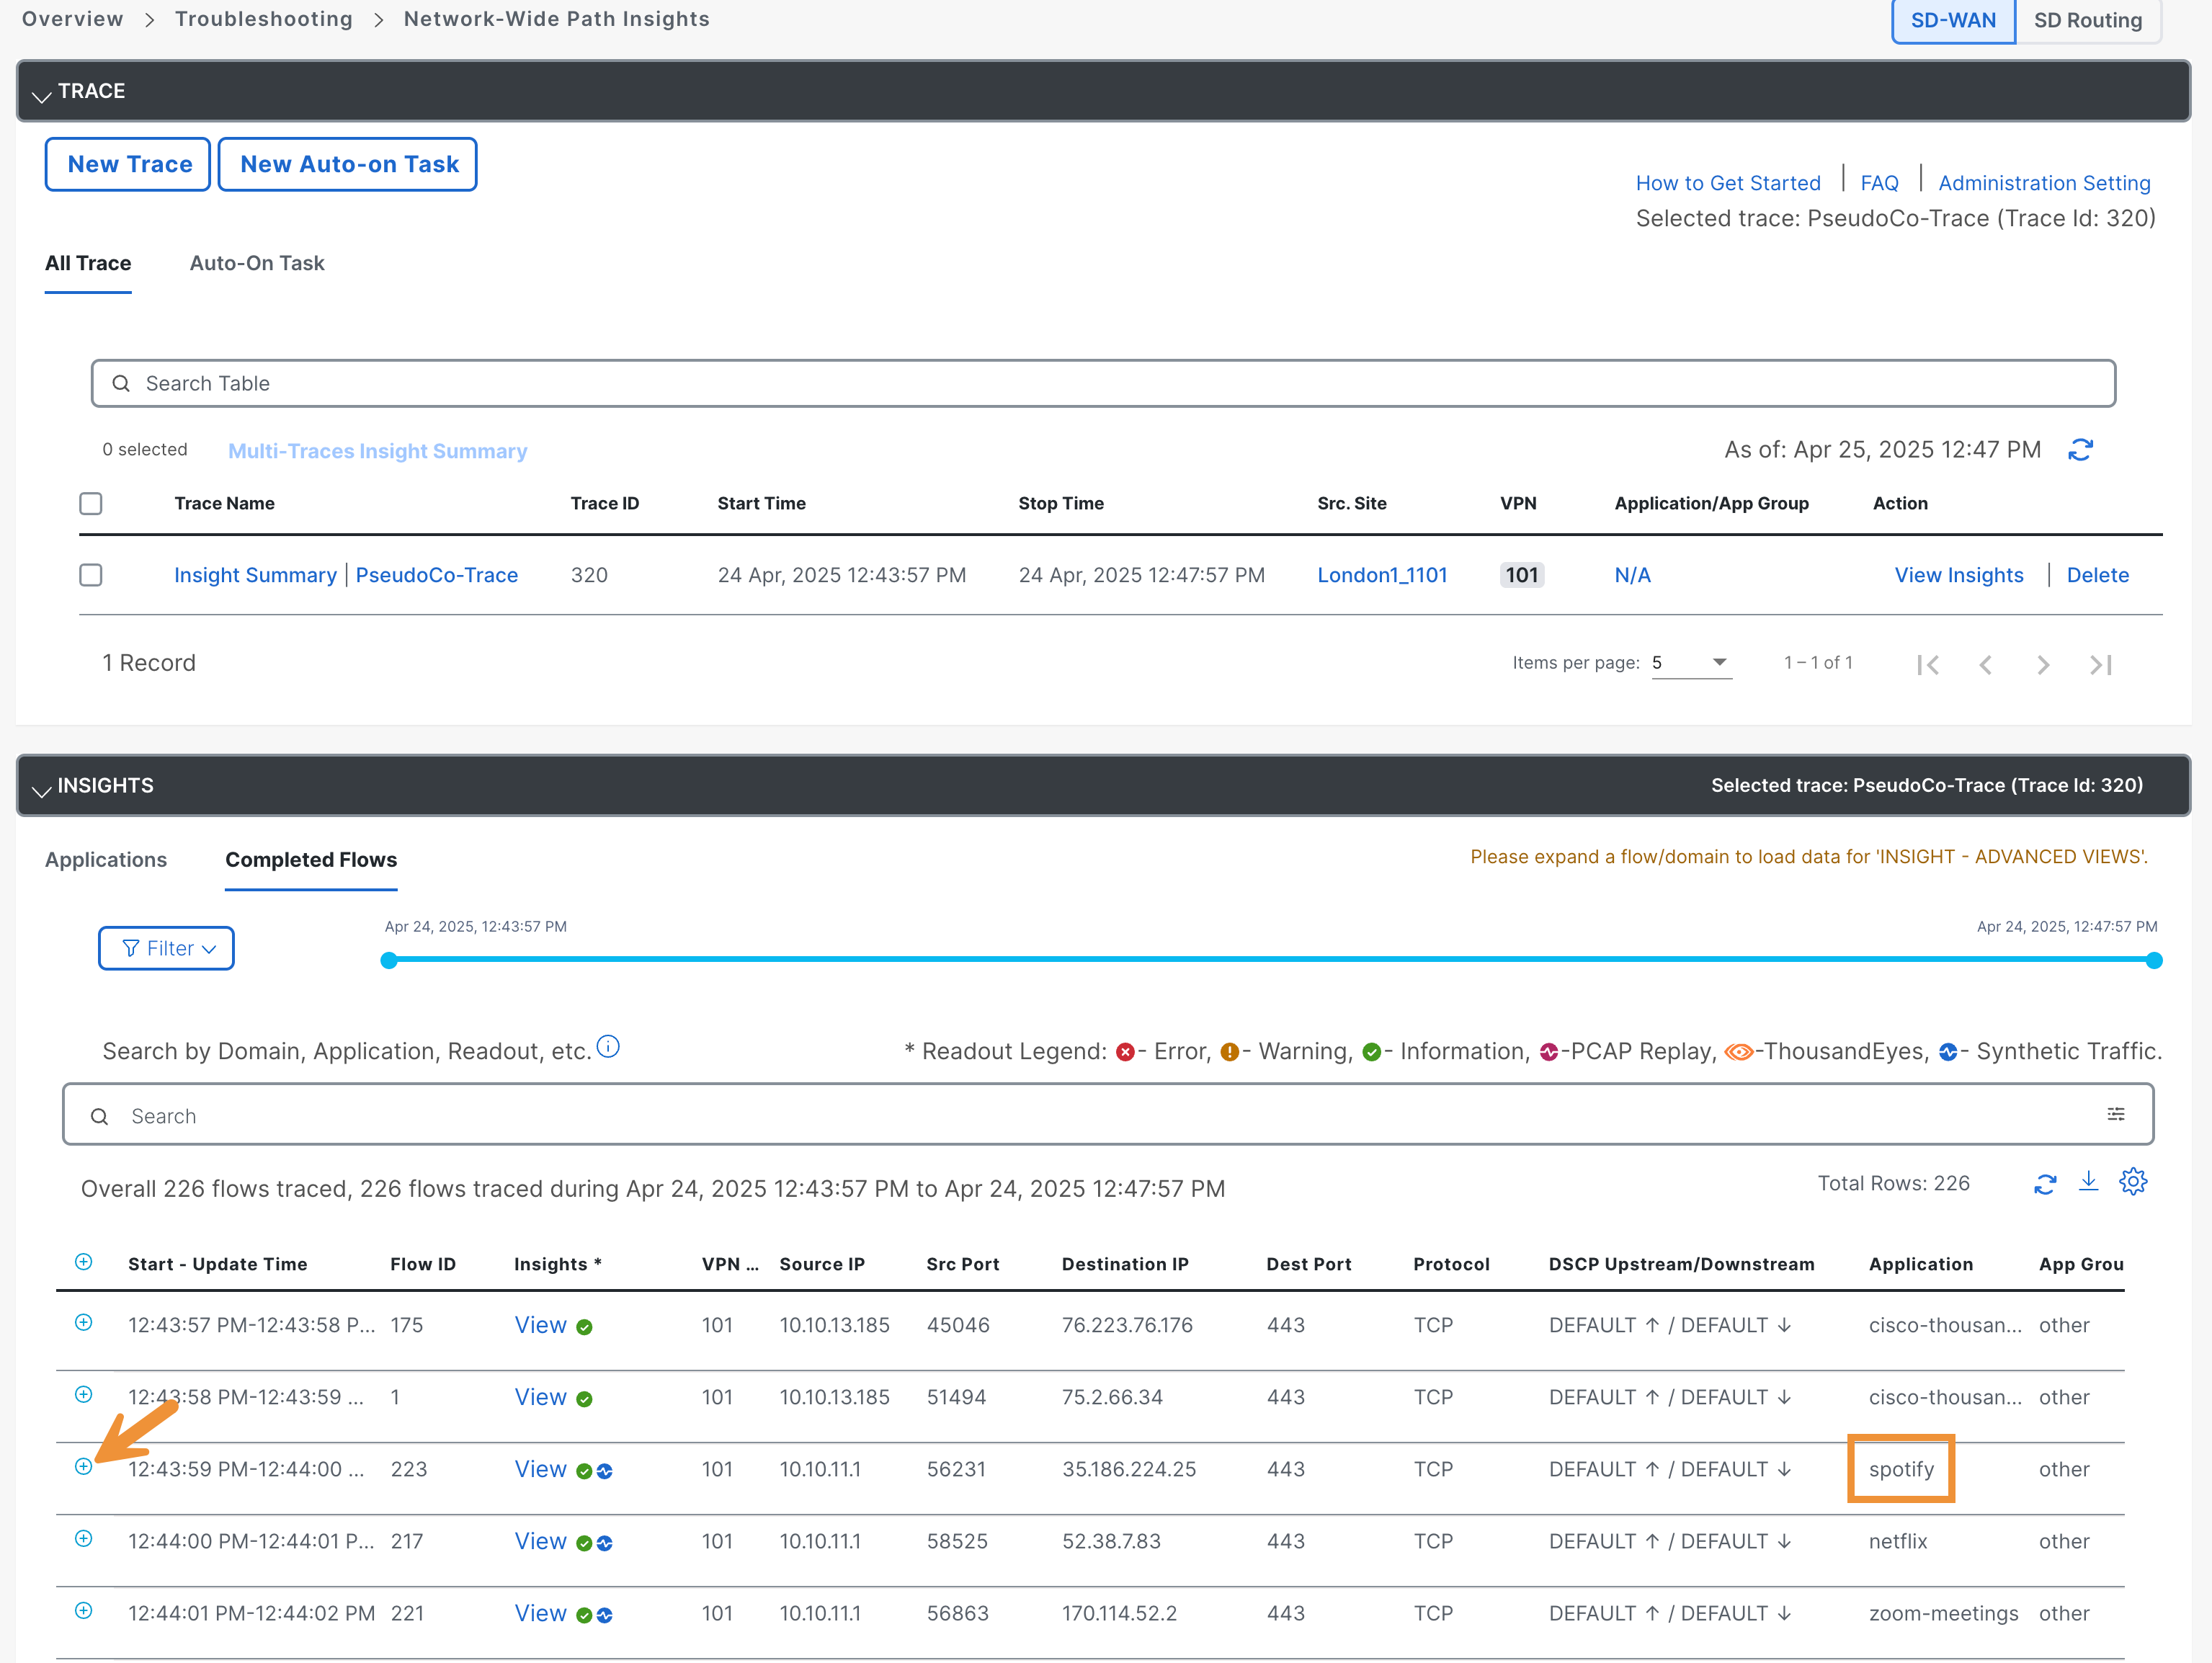
Review the information provided.
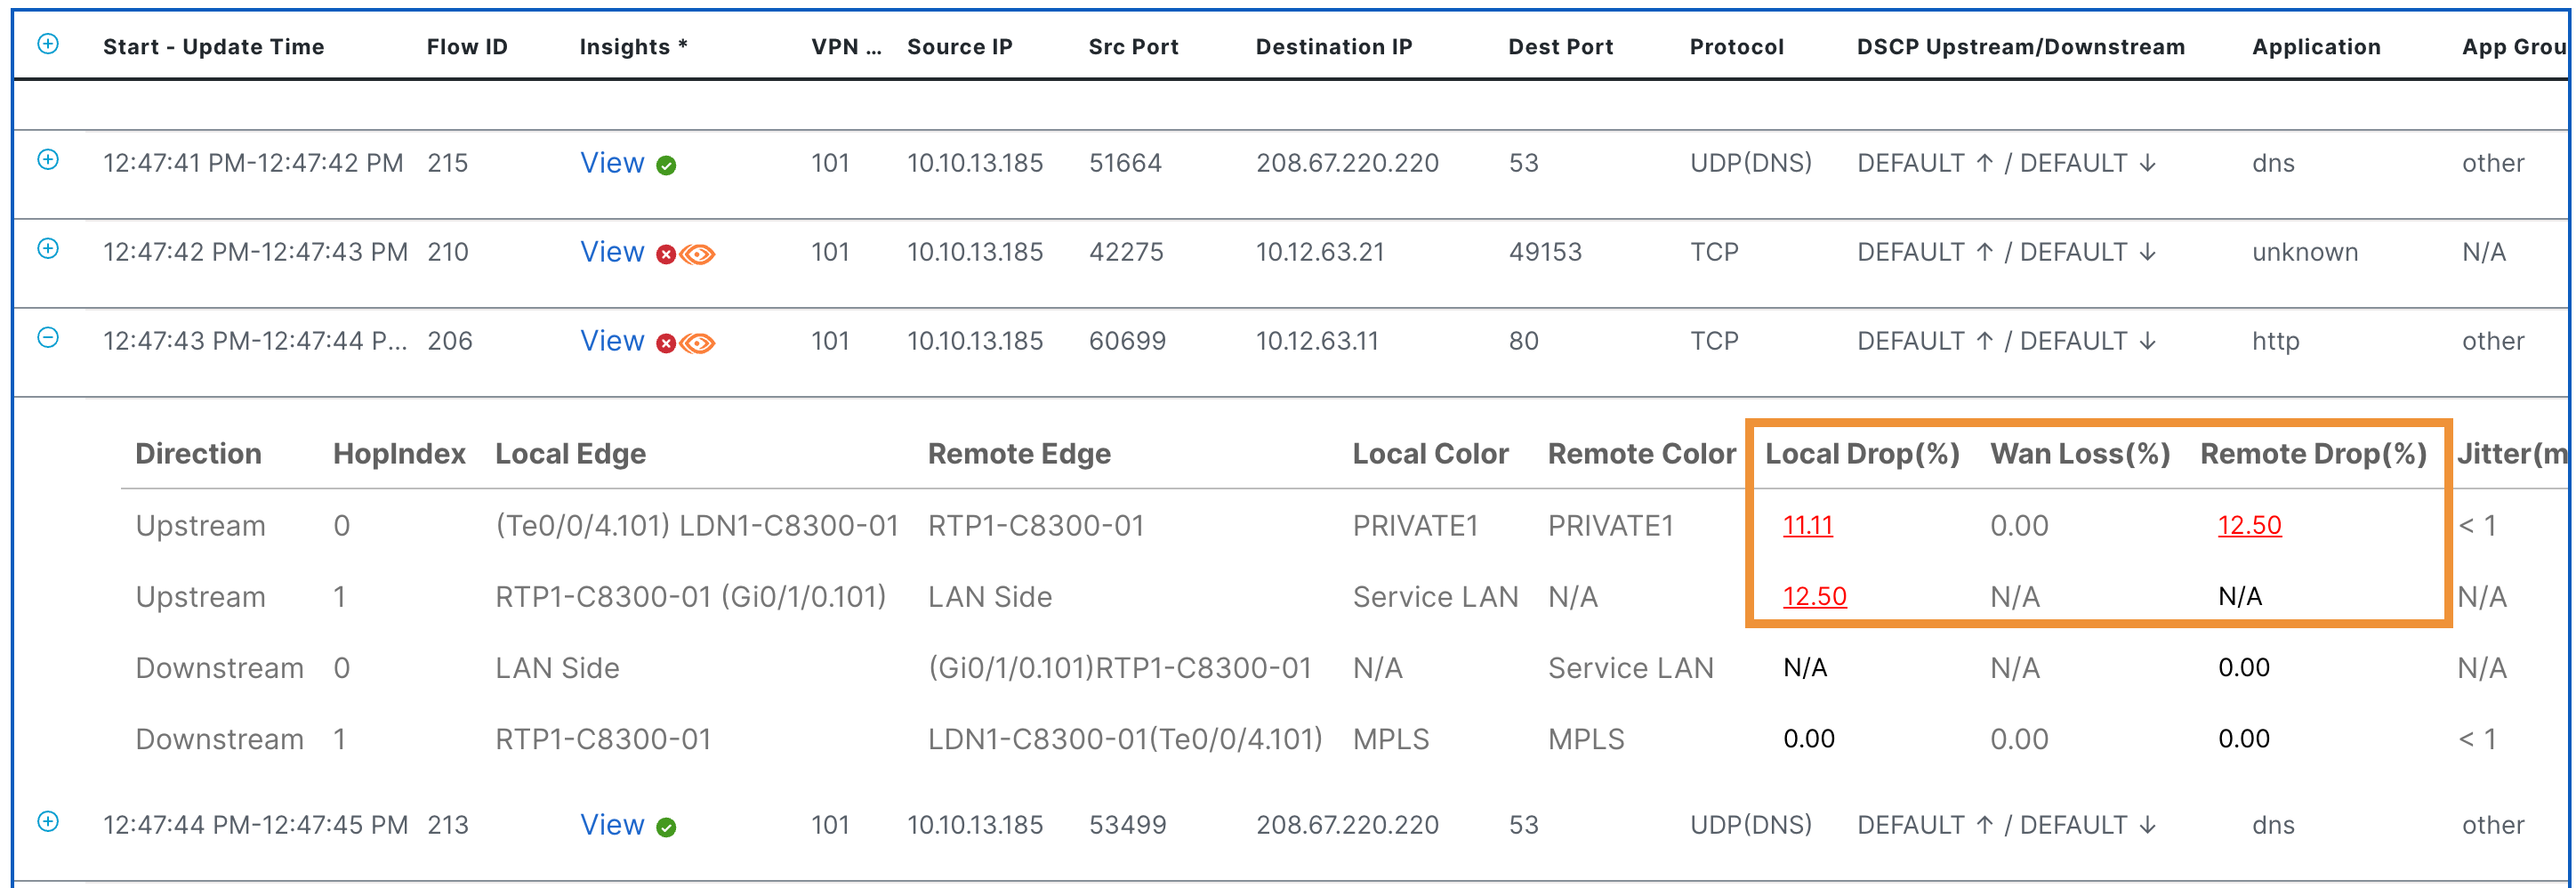
Now select another flow that features the ThousandEyes icon. Then, double-click on the + sign to expand the information.
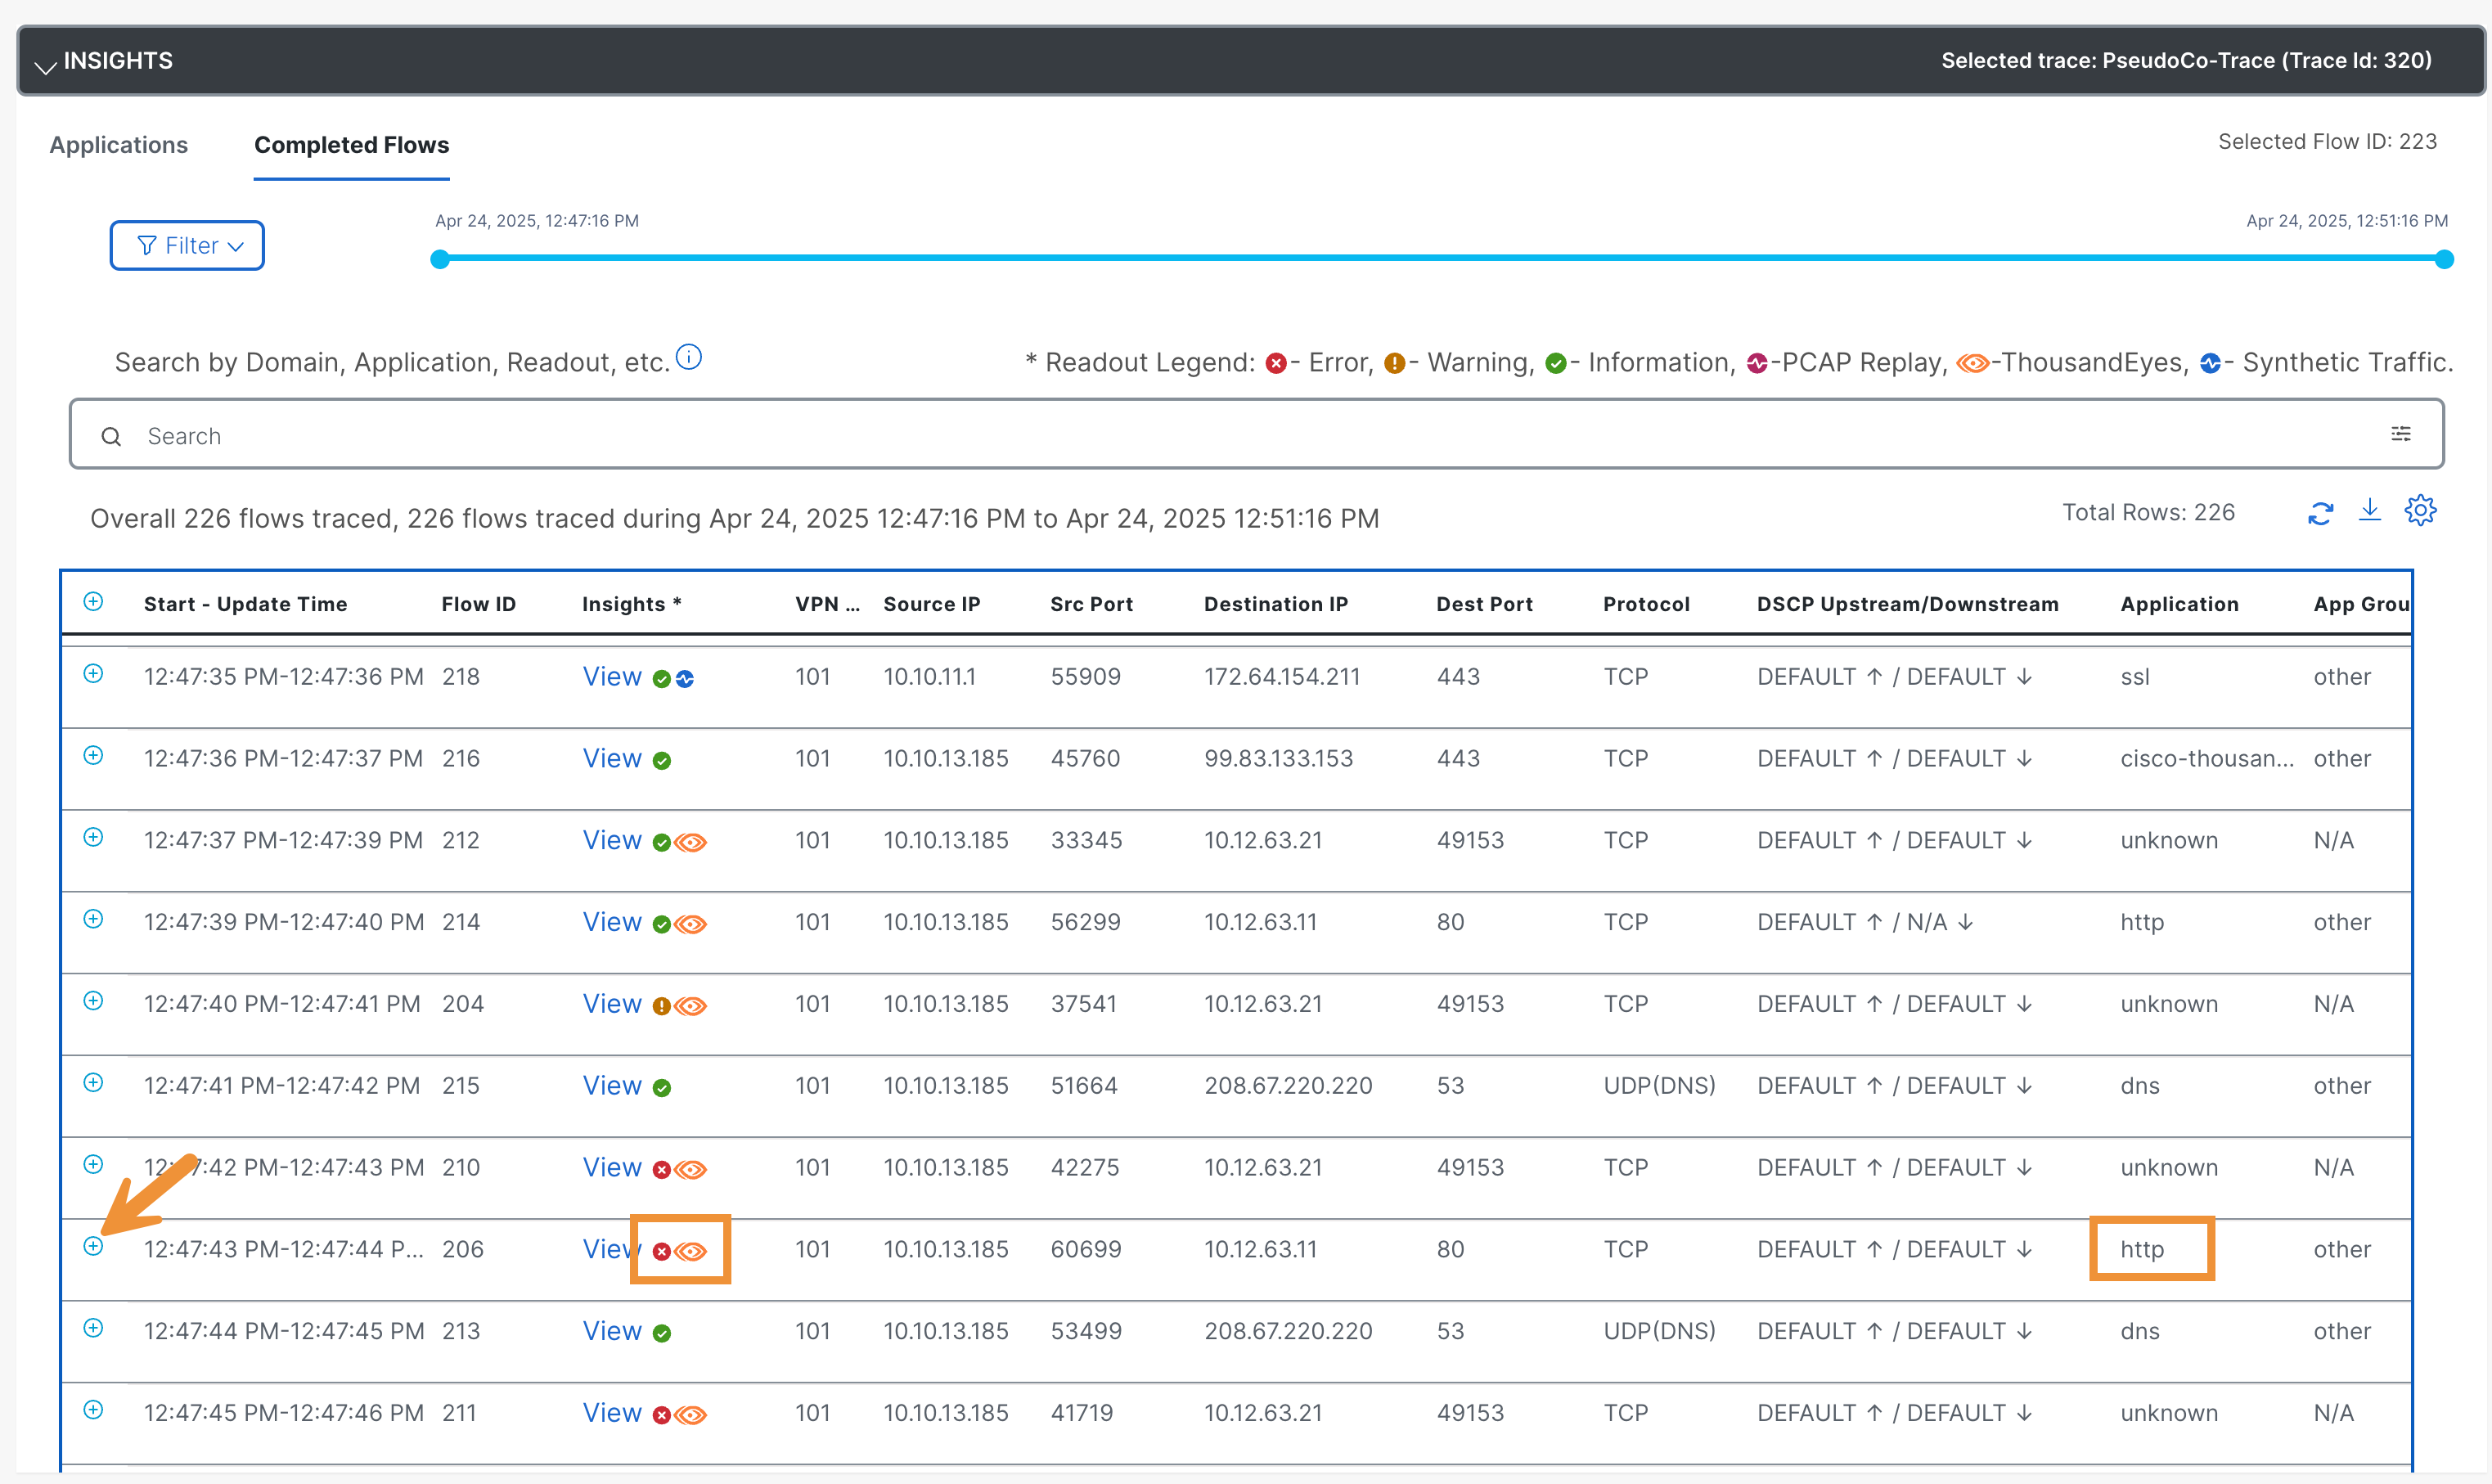
- By default, ThousandEyes is unable to see through SD-WAN edge devices. For example, TE can identify loss in an SD-WAN flow, but it cannot offer additional insights for remediation. By integrating TE and NWPI, it becomes possible for NWPI to gather and correlate flow-level details. For instance, if TE test traffic is dropped in the SD-WAN fabric due to QoS congestion, NWPI can now provide broader insights.
Scroll up and now click on Insight Summary. Review the data.
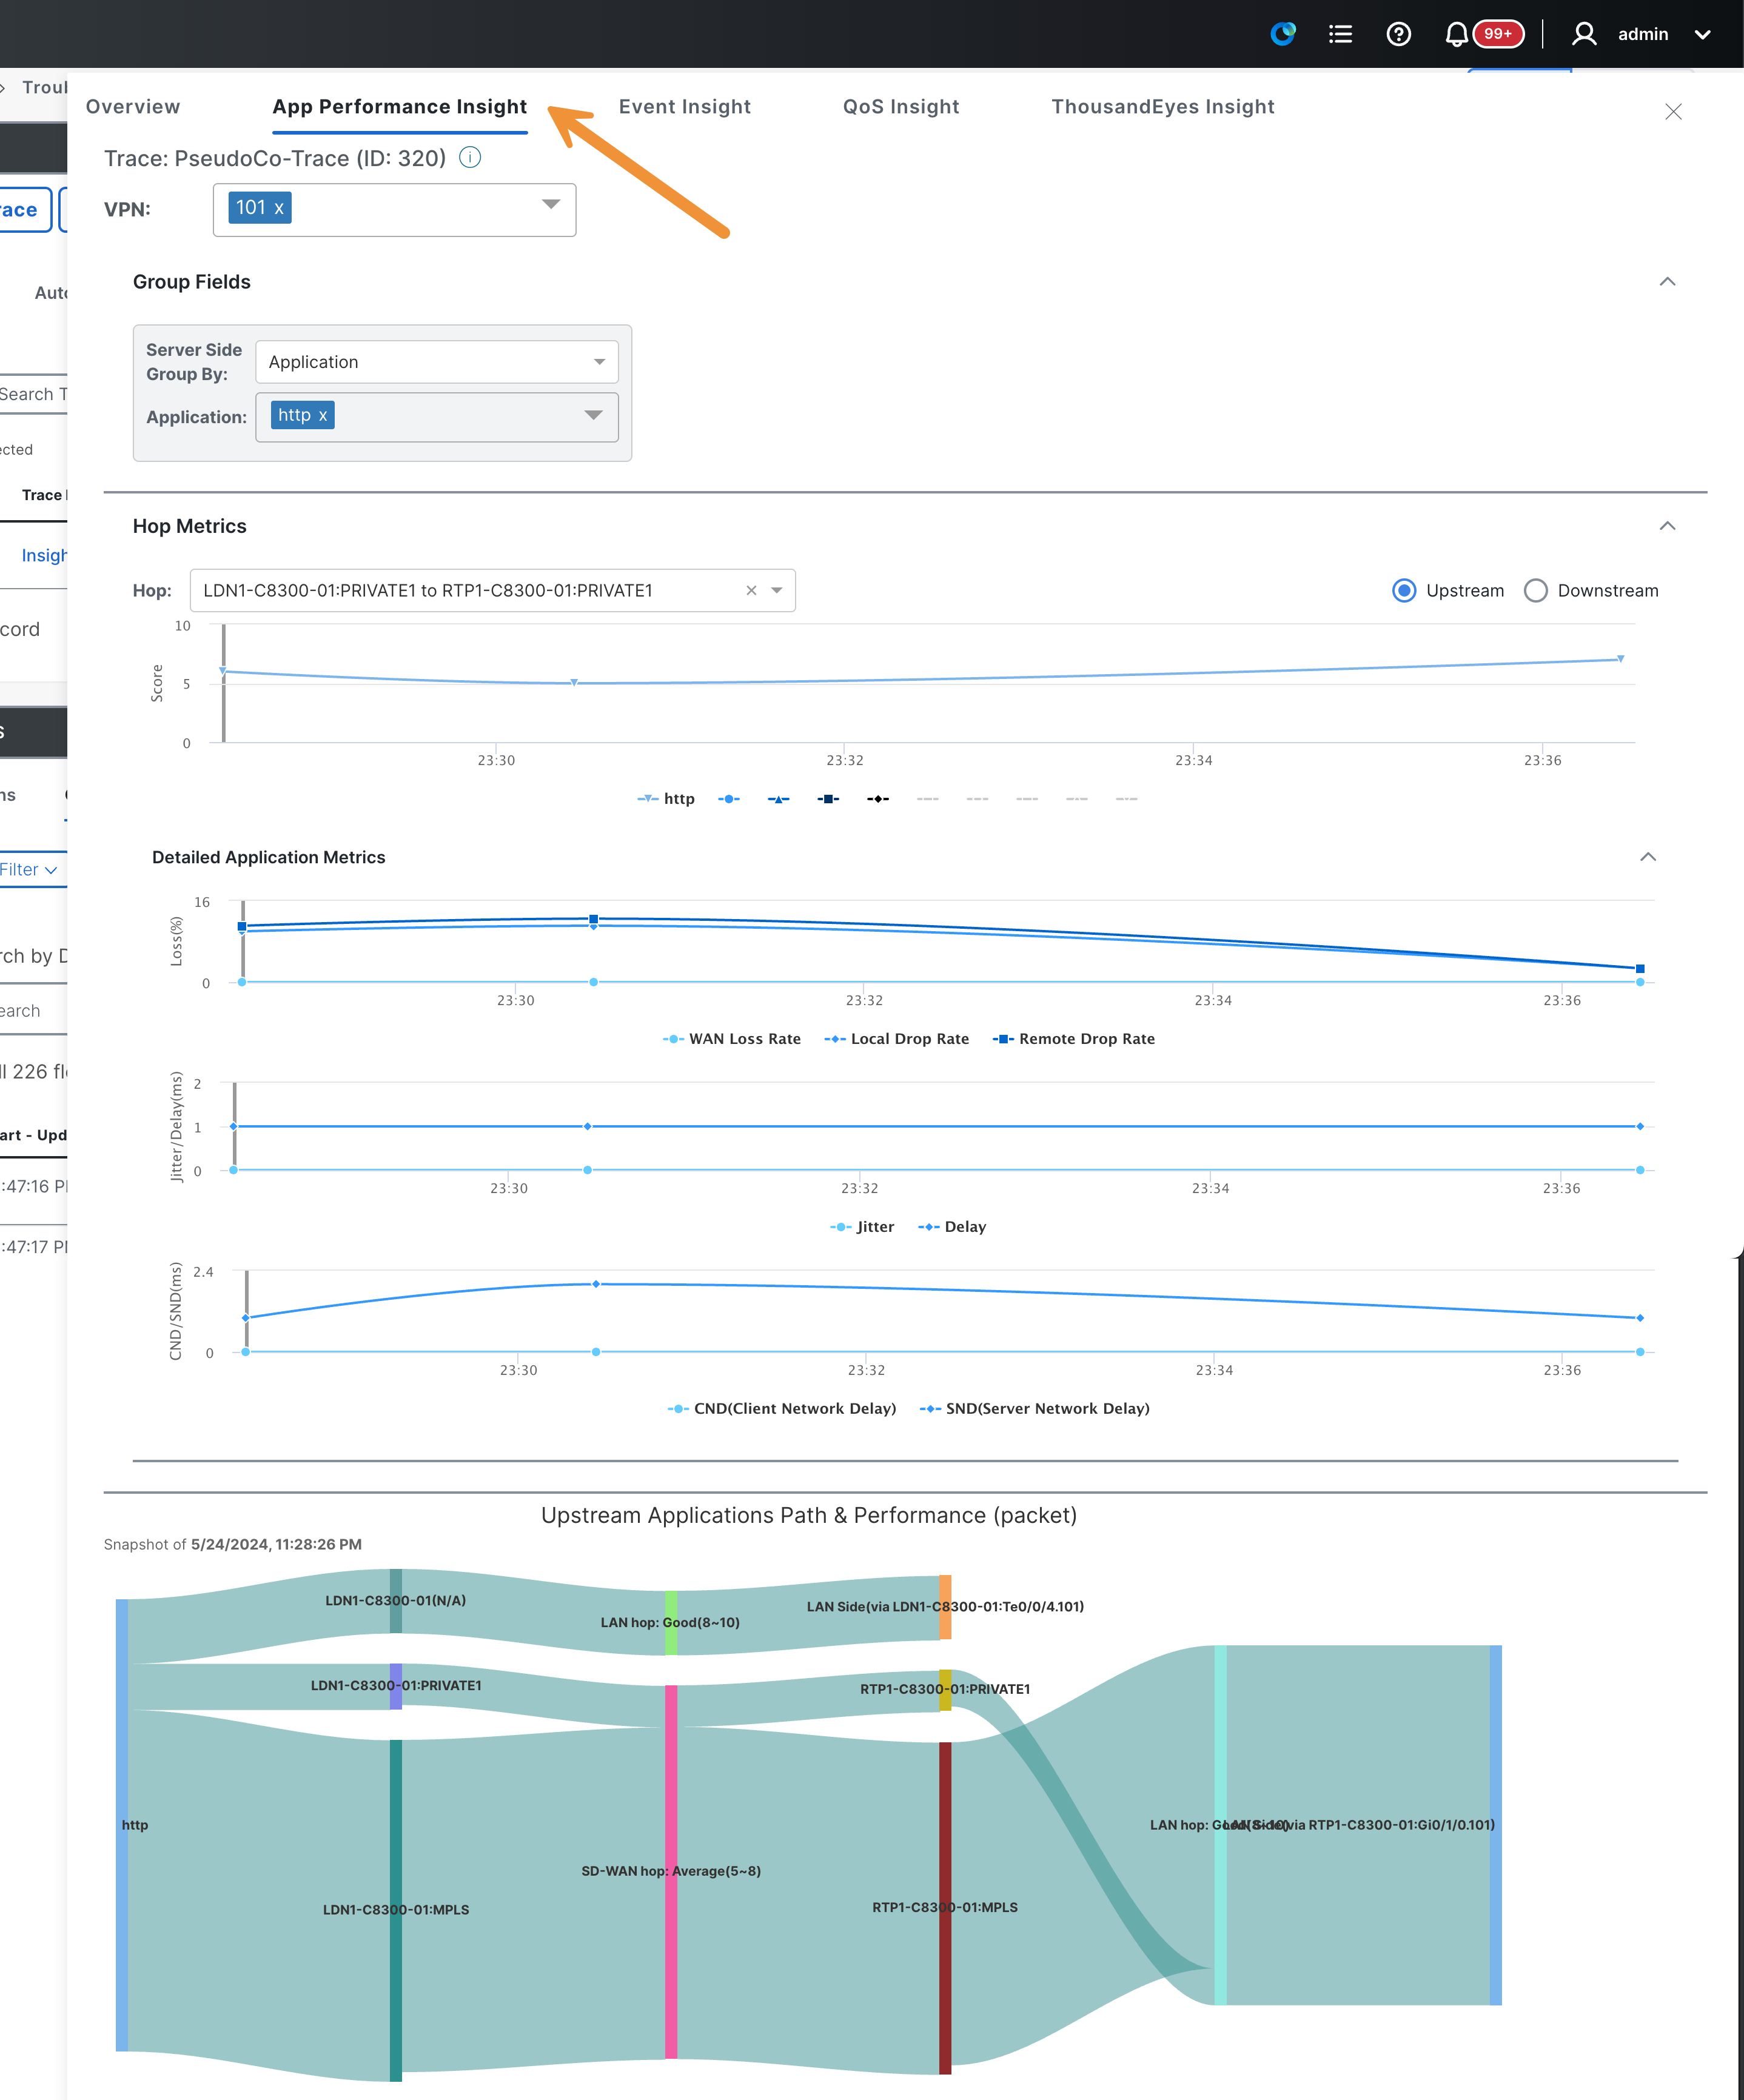
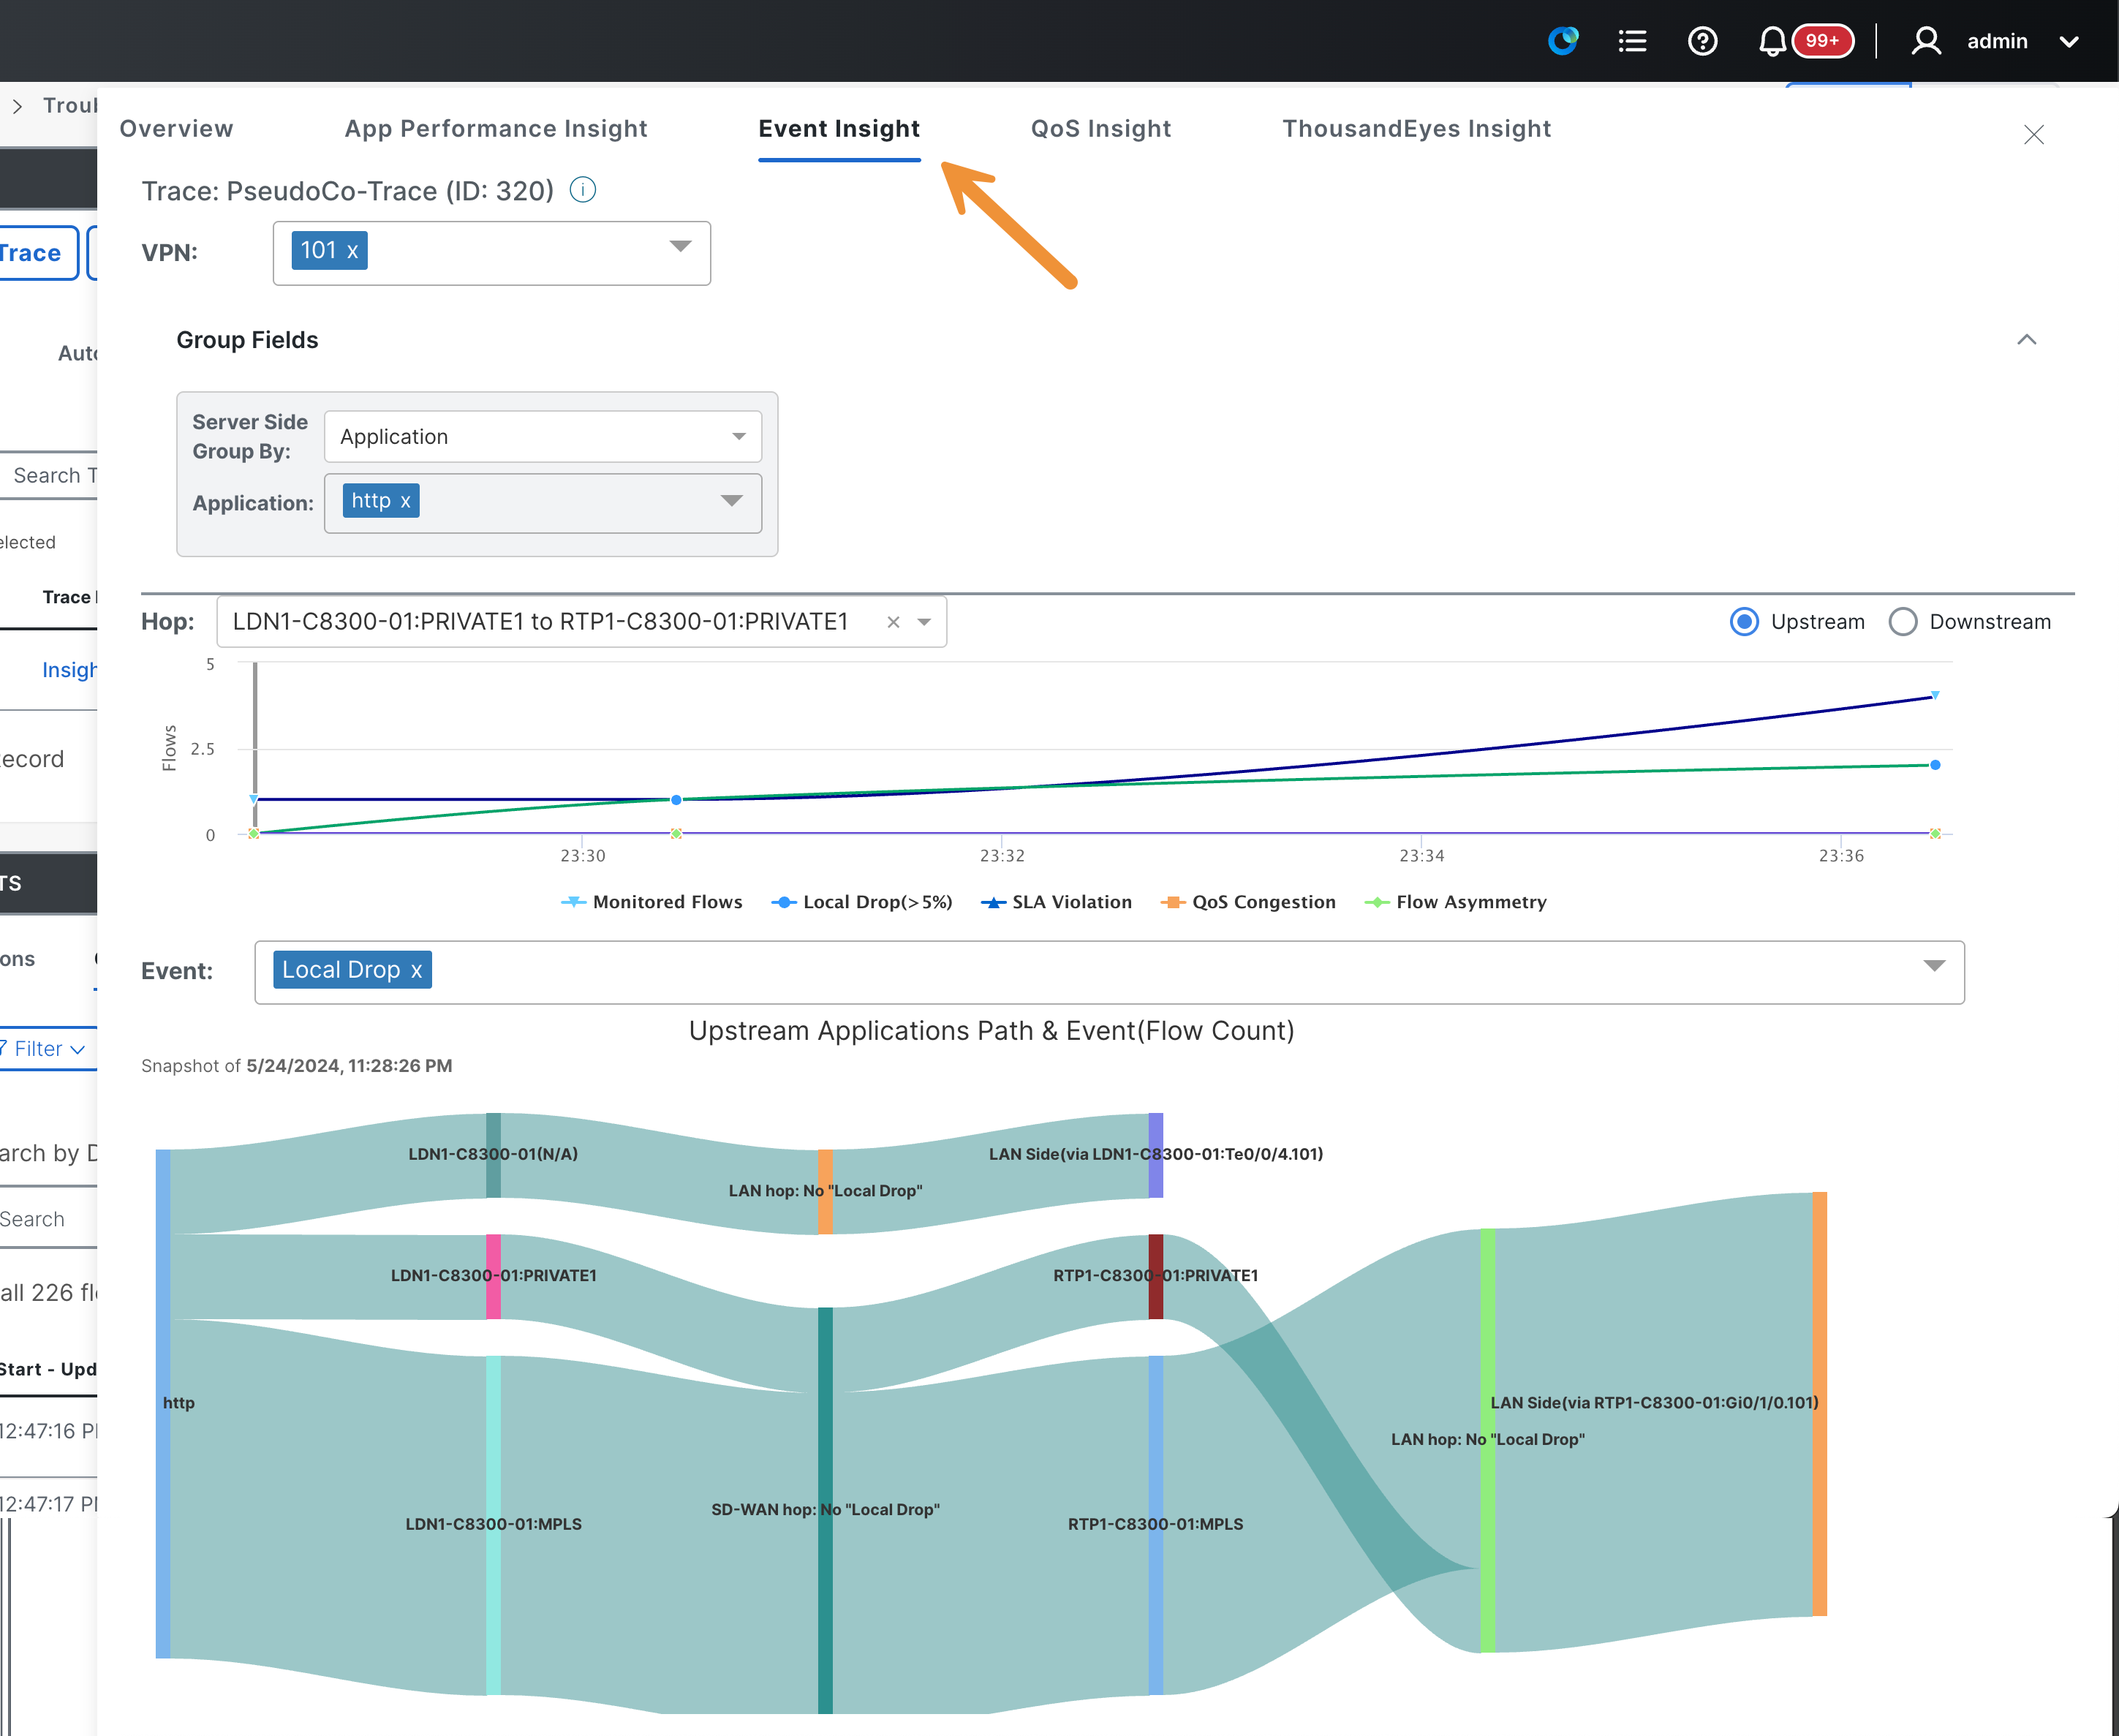
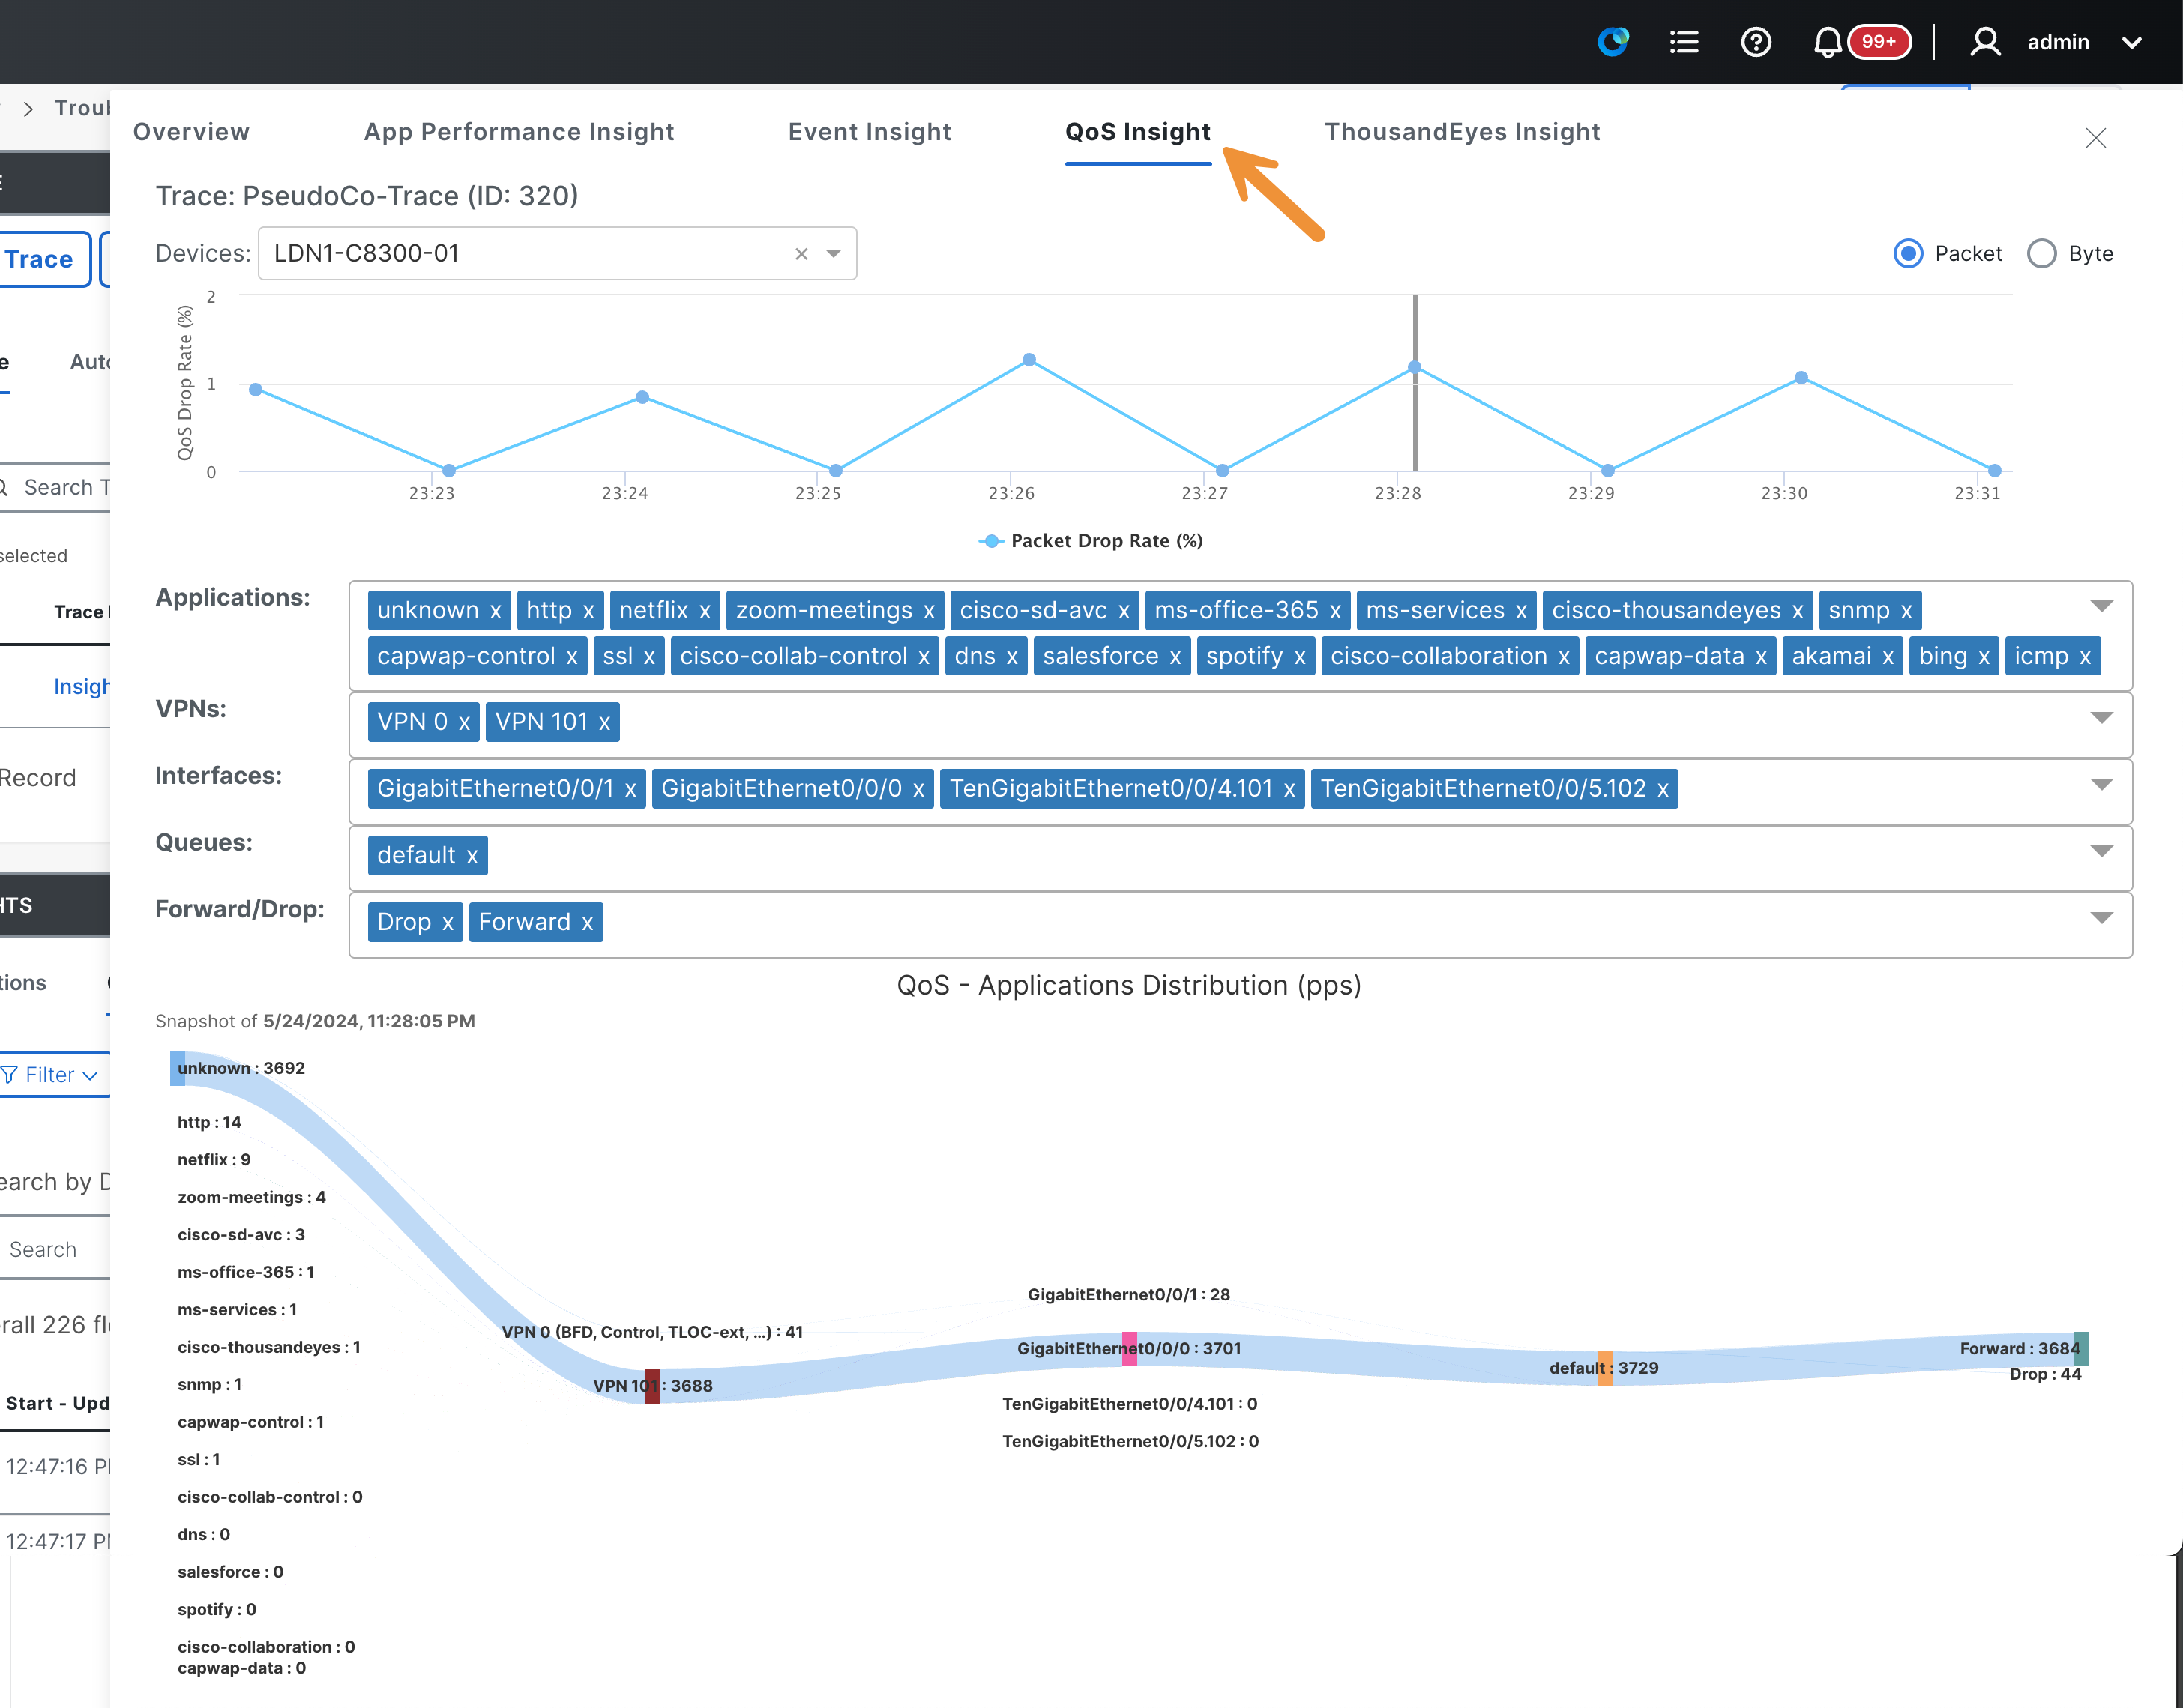
Click on App Performance Insight, Event Insight and QoS Insight. Review the data within each tab.
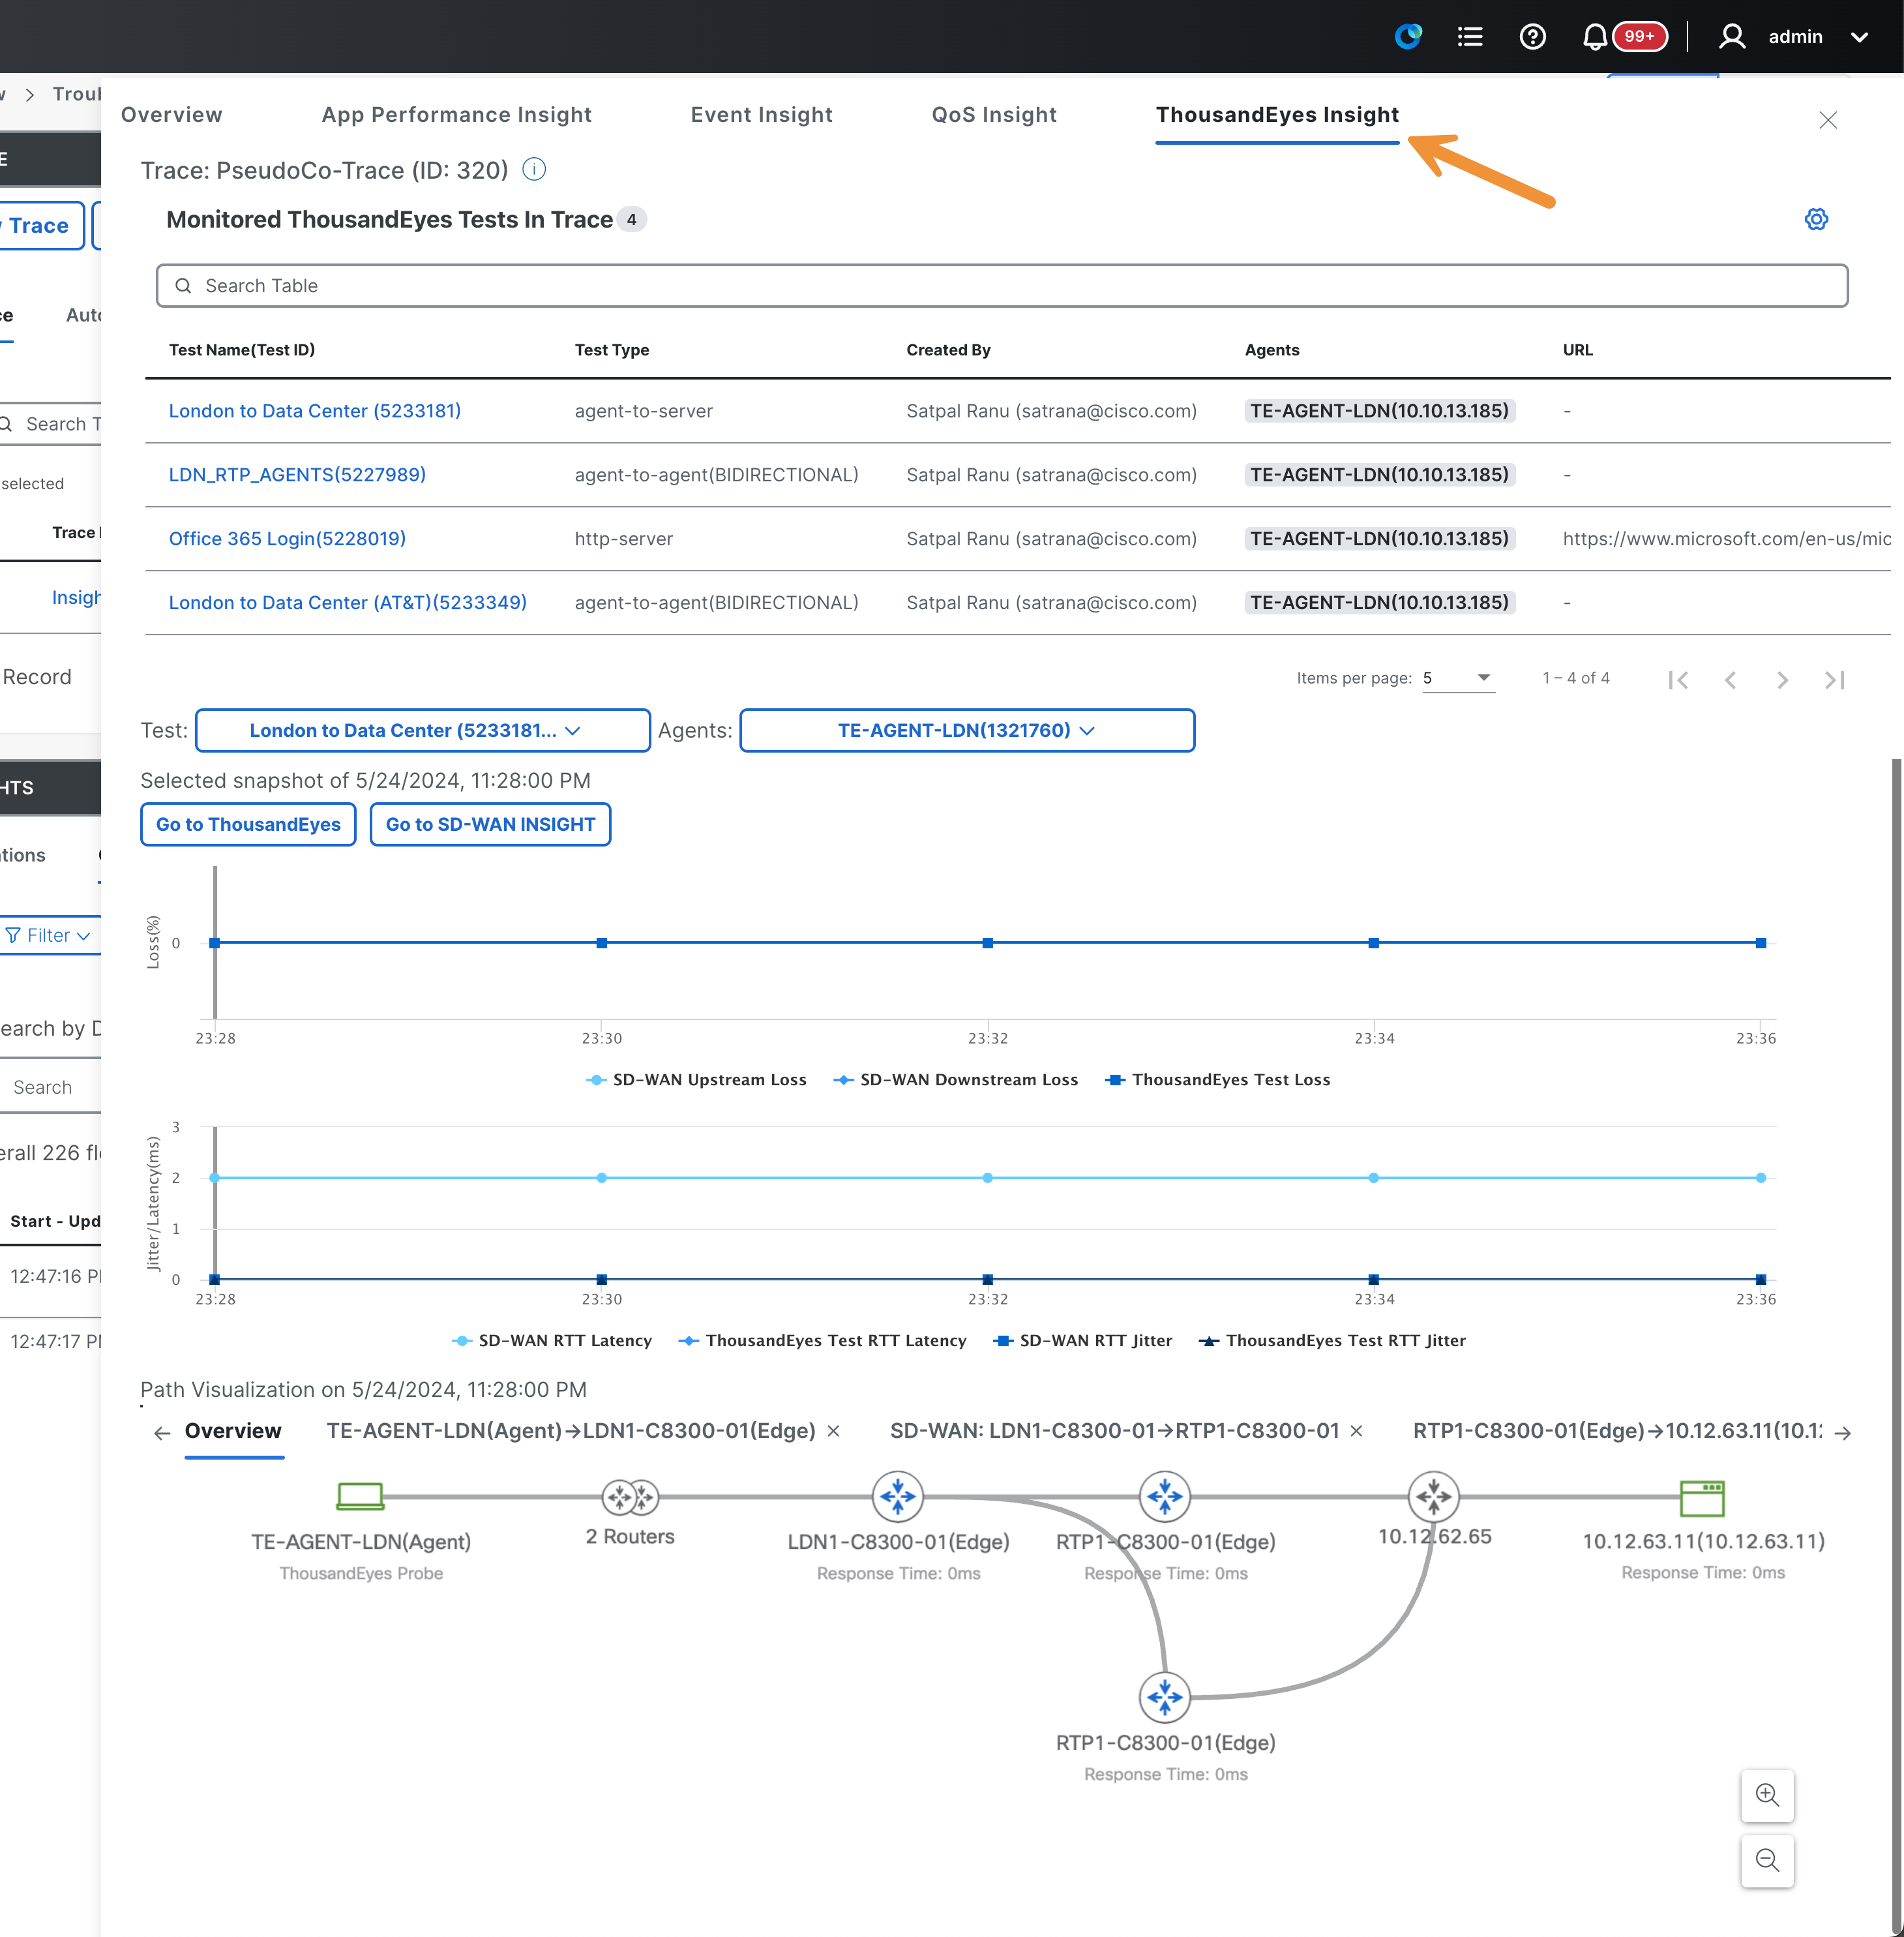
Click on ThousandEyes Insight. Review the additional information provided by the ThousandEyes solution. Scroll down to find the Path Visualization and hover over the different hubs.
After you have finished reviewing the data, click on the X on the top to close the window.