Security Capabilities on Catalyst SD-WAN
Catalyst SD-WAN empowers robust on-premises security by extending distributed security directly to the network edge. This simplifies compliance efforts while offering continuous protection against evolving threats, both internal and external.
It also offers comprehensive Secure Access Service Edge (SASE) capabilities through a seamless integration with various Secure Service Edge (SSE) solutions.
This section covers:
- Security capabilities of the WAN Edges such as Advanced Malware Protection (AMP), Intrusion Prevention (IPS), URL Filtering (URLF) and Next Generation Firewall (NGFW). The tight integration between Catalyst SD-WAN and Cisco Identity Services Engine (ISE) also enables SGT-based security functions for the traffic that goes through an SD-WAN fabric (SGT = Security Group Tag)
- The integration with cloud-based SSE providers such as Cisco Secure Access and Zscaler.
Security Dashboard Overview
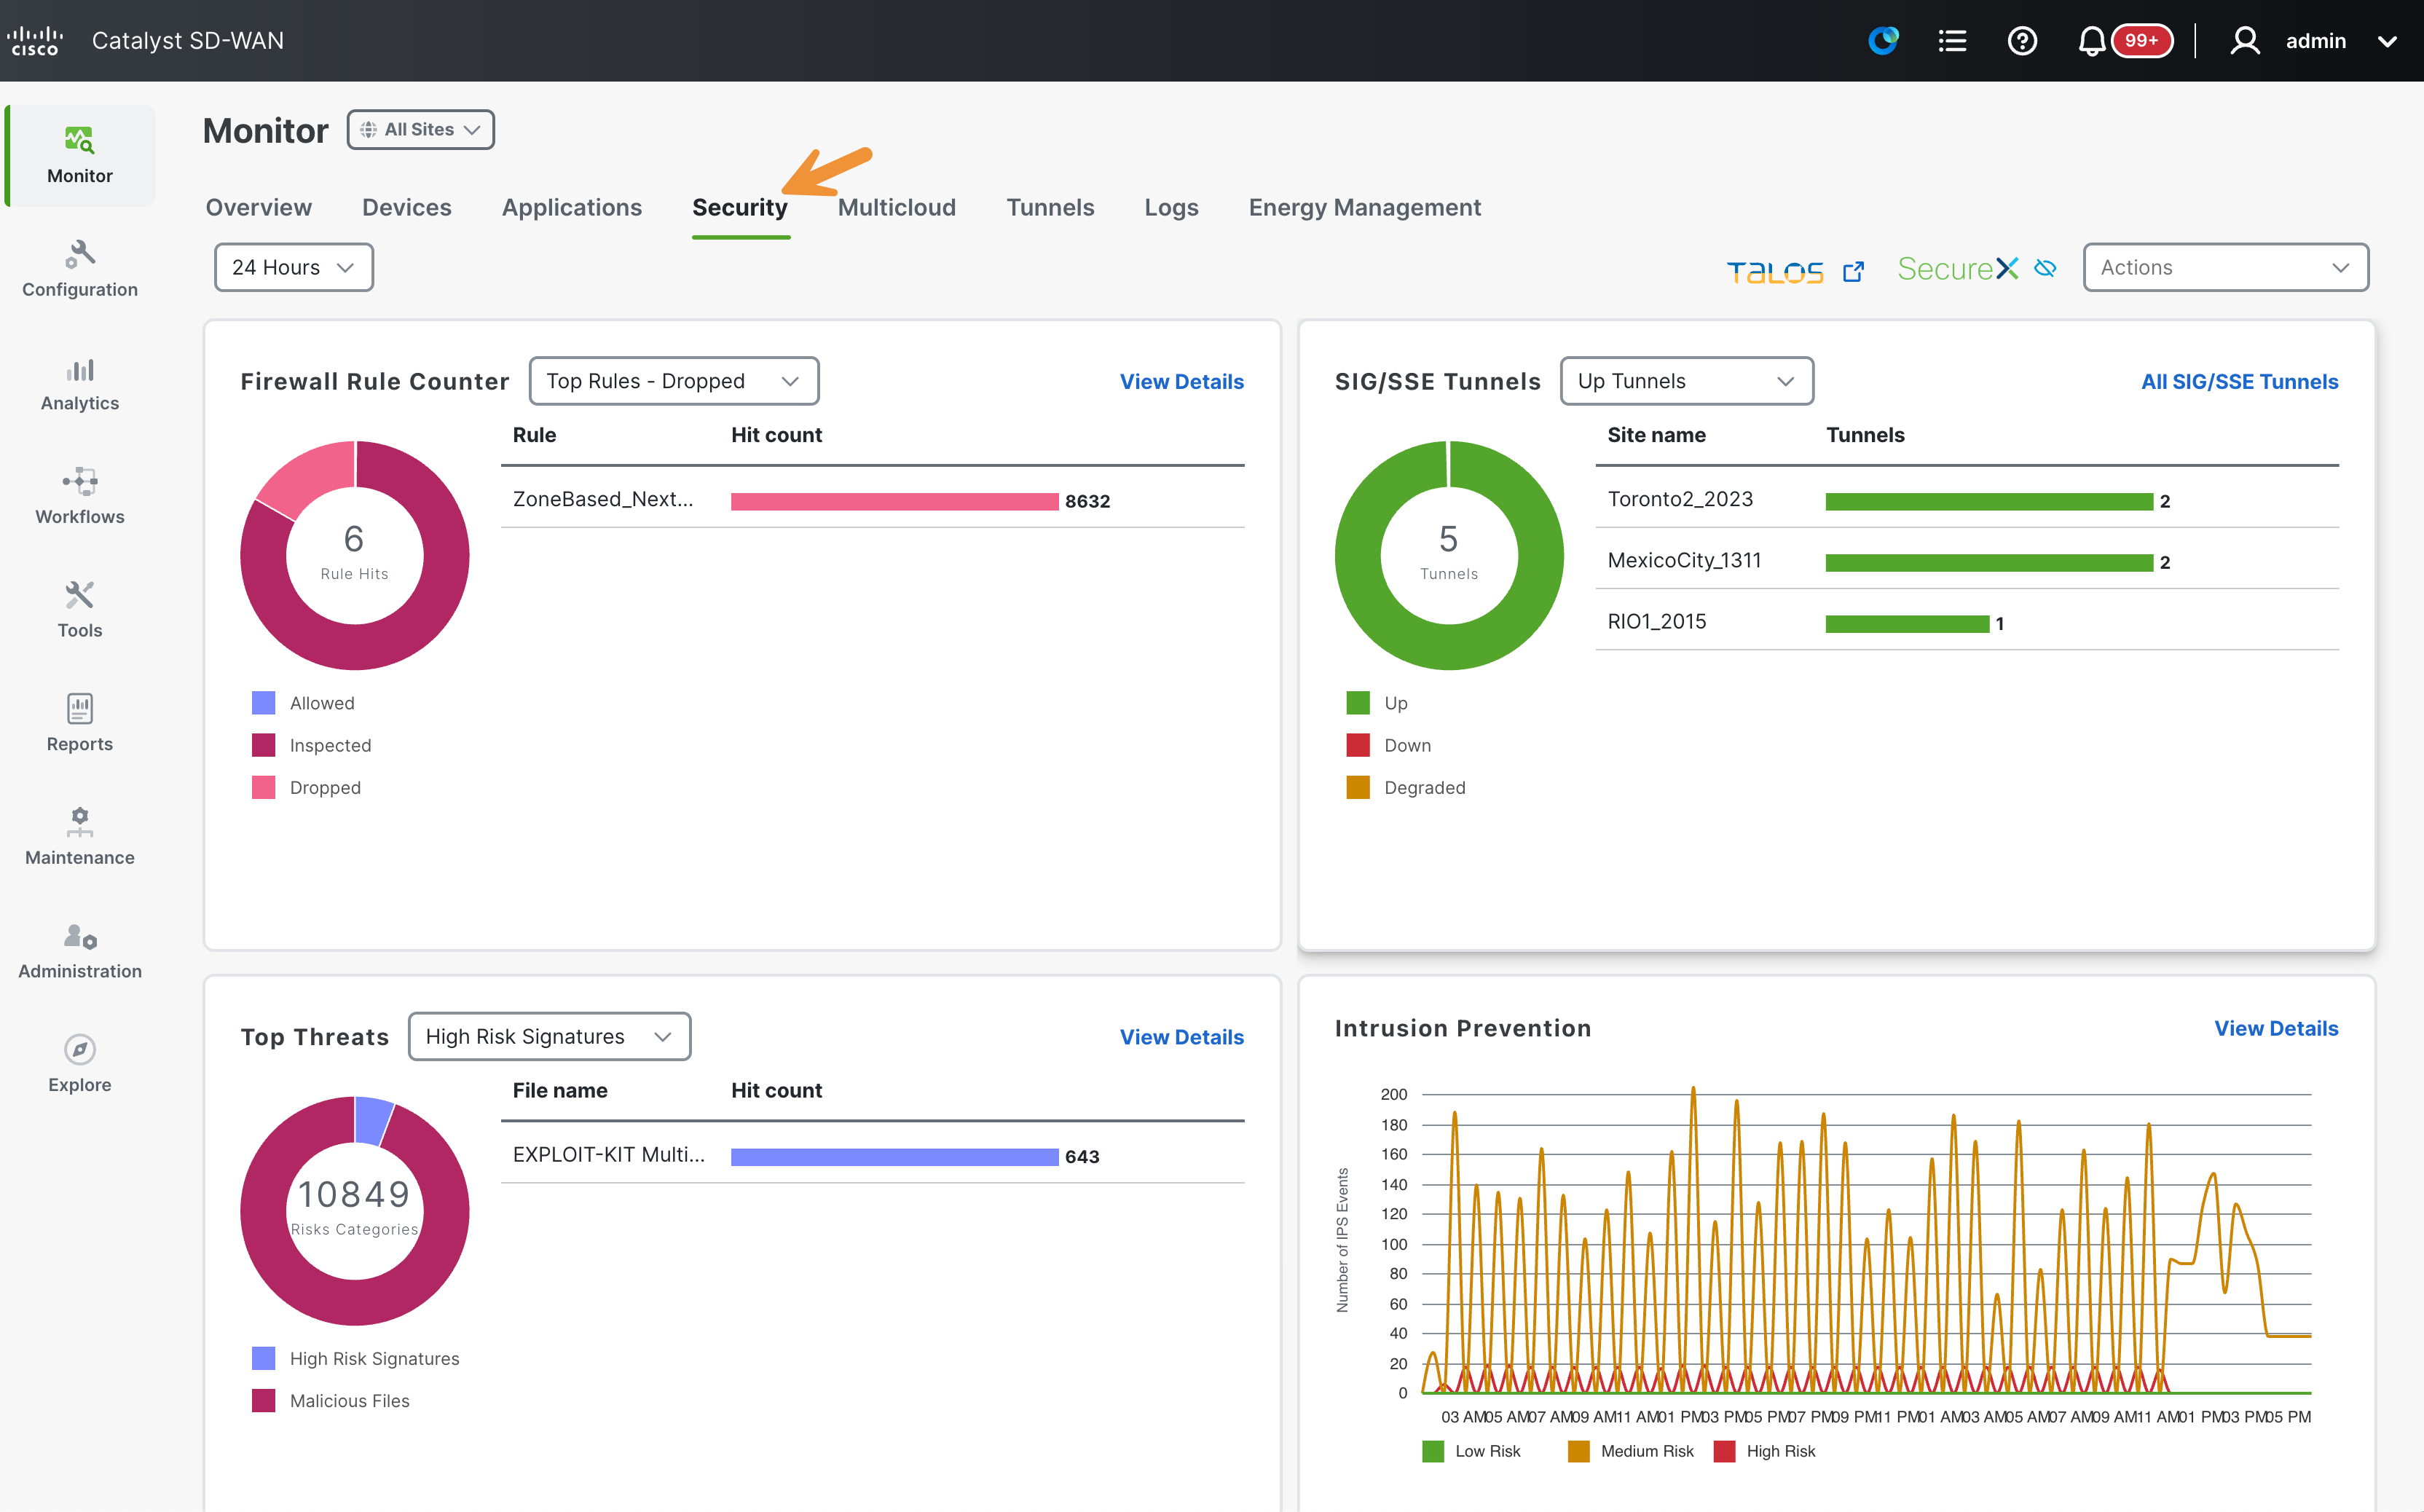
To start, navigate to Monitor > Security in the SD-WAN Manager.

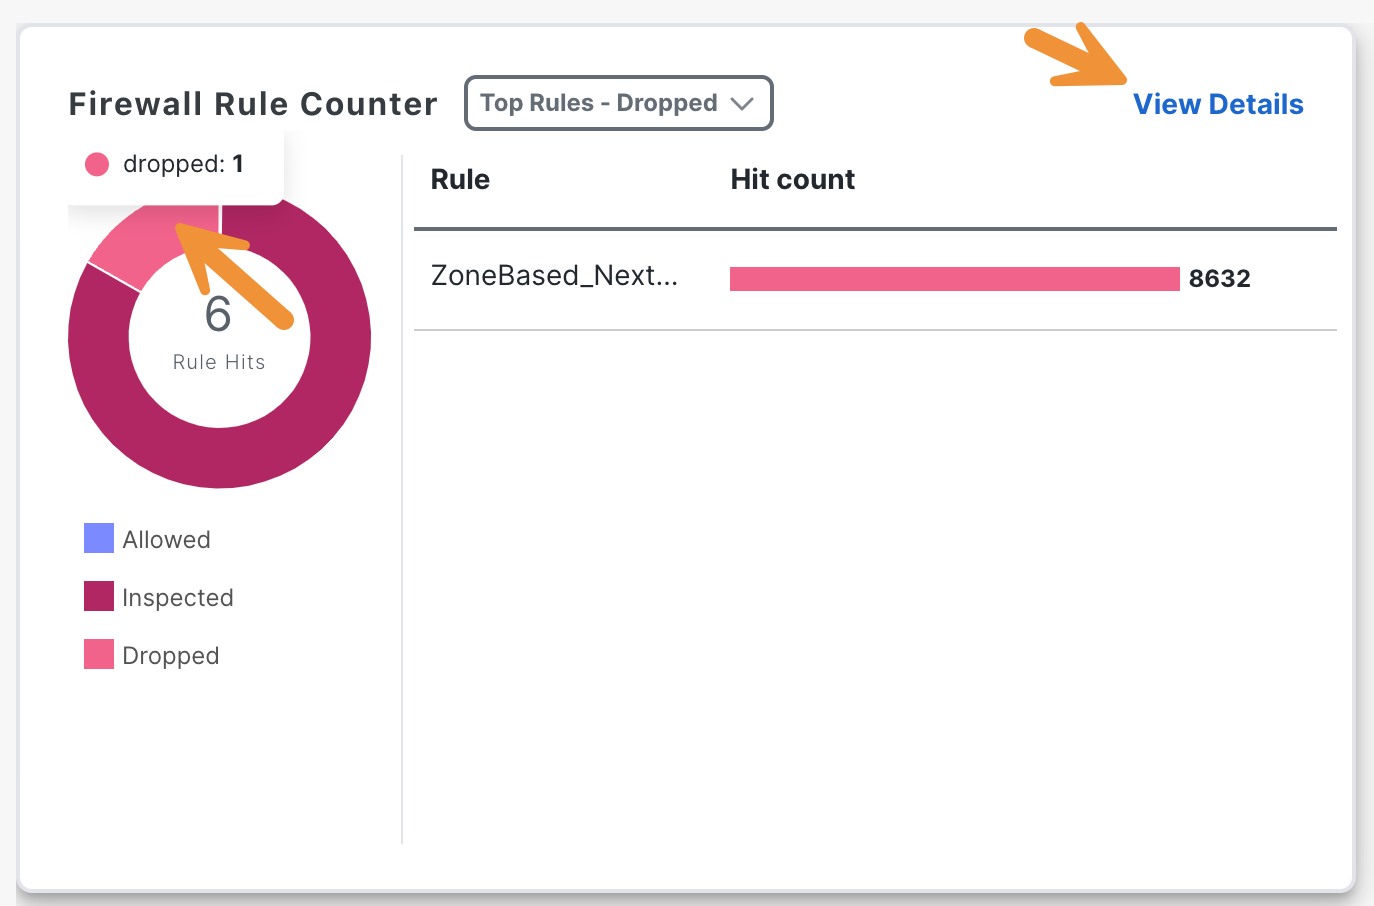
Hover over the graph in the Firewall Rule Counter section to locate the number of rule hits (allowed, inspected, dropped). Then, click on View Details.
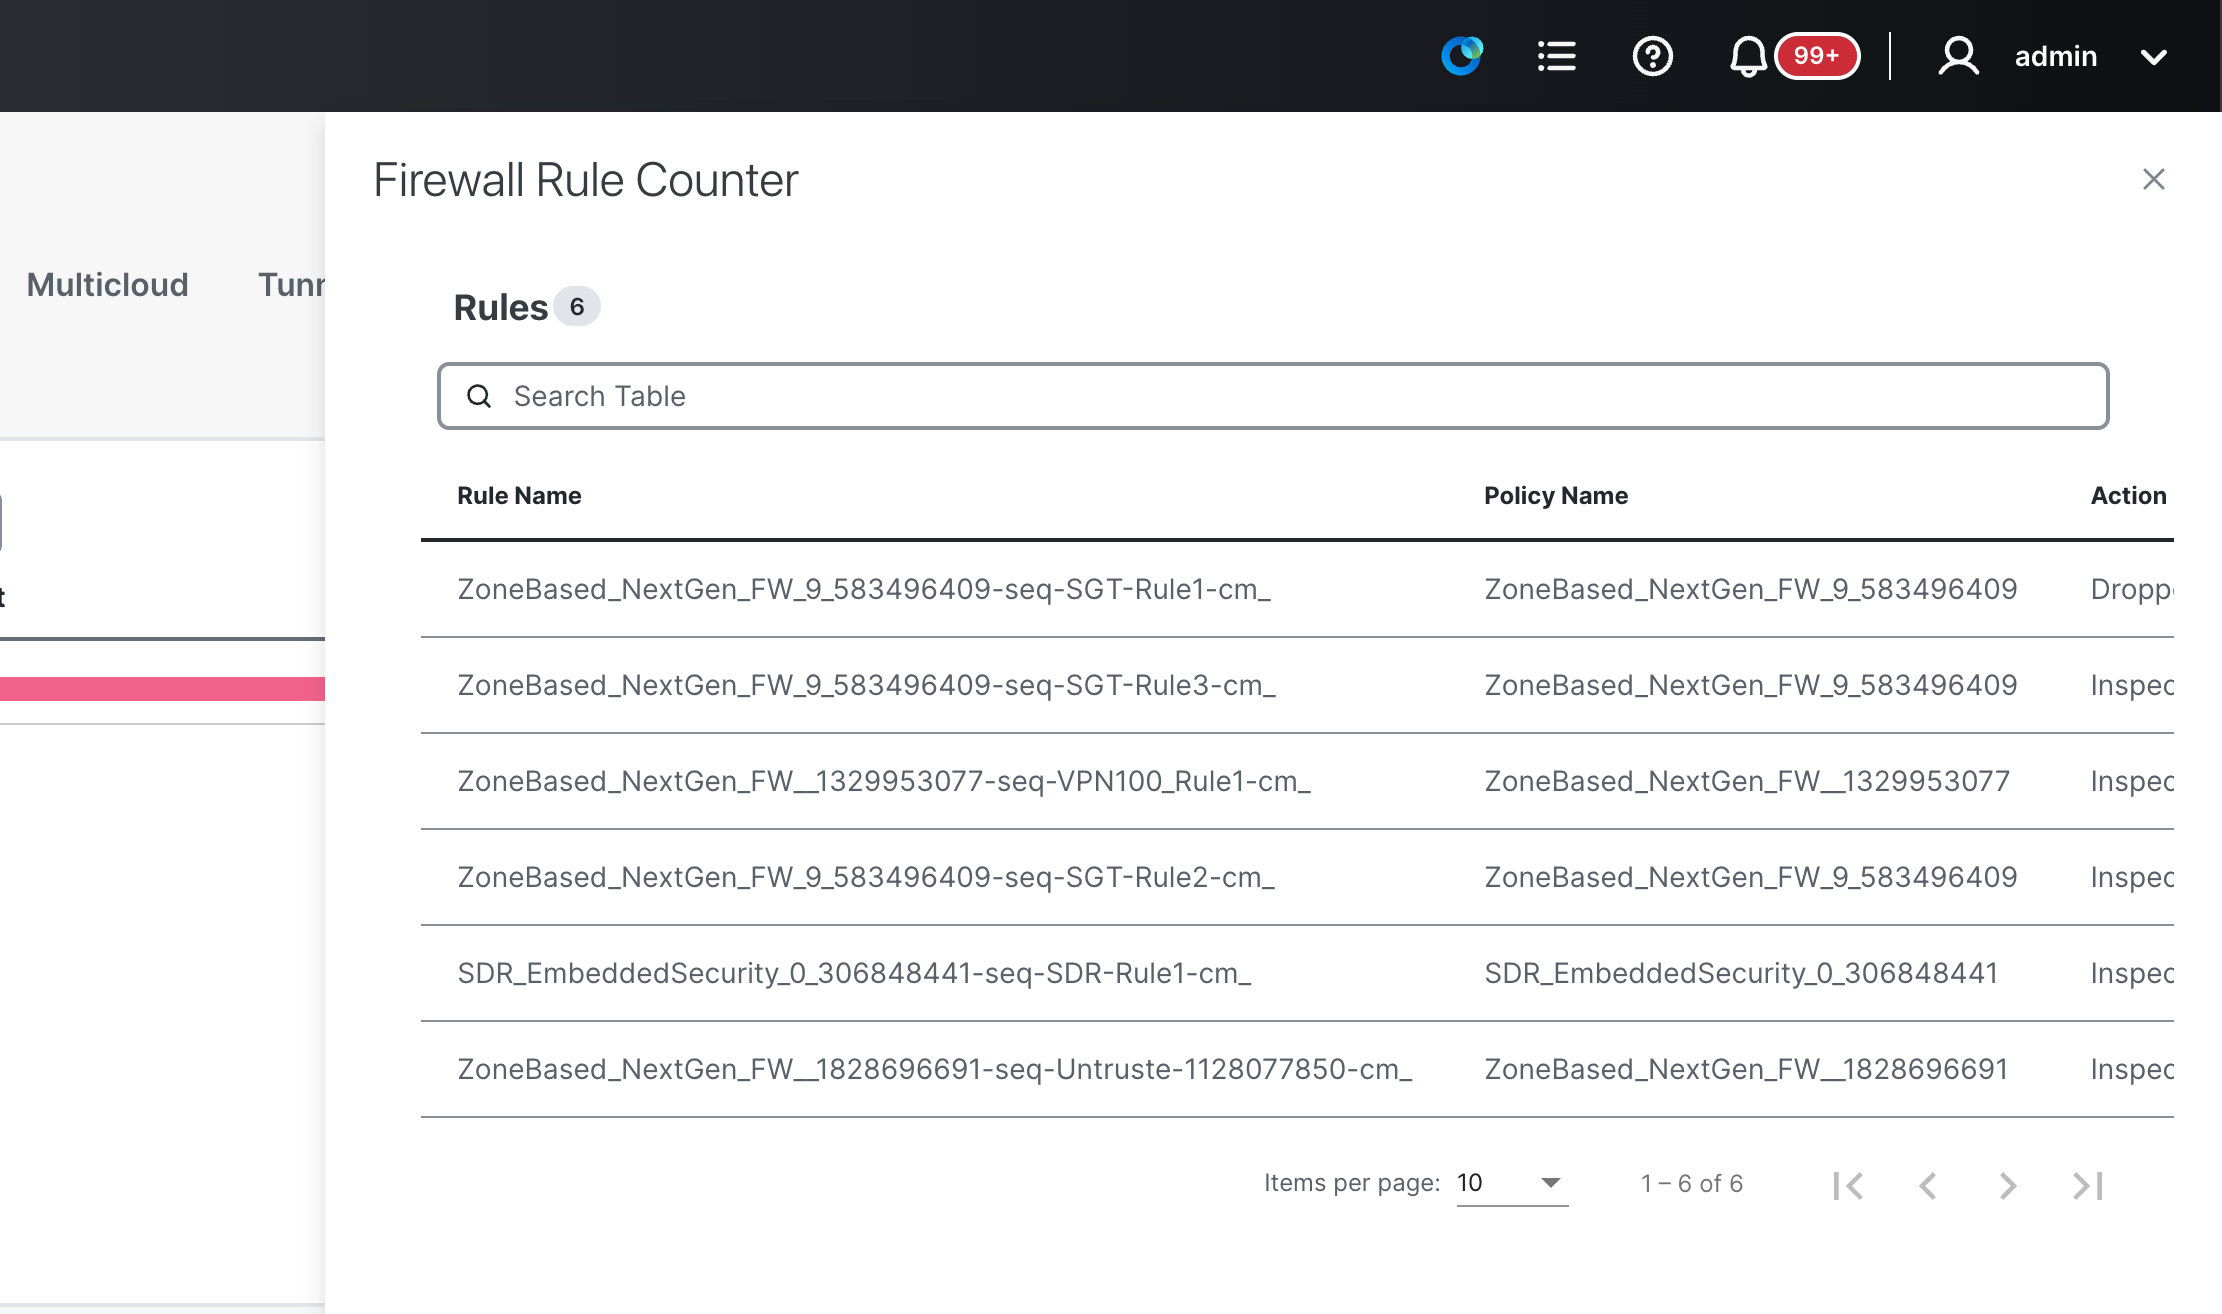
In the slide-out panel that appears, you will find a list containing the names of the rules, the action taken, and the number of hits.
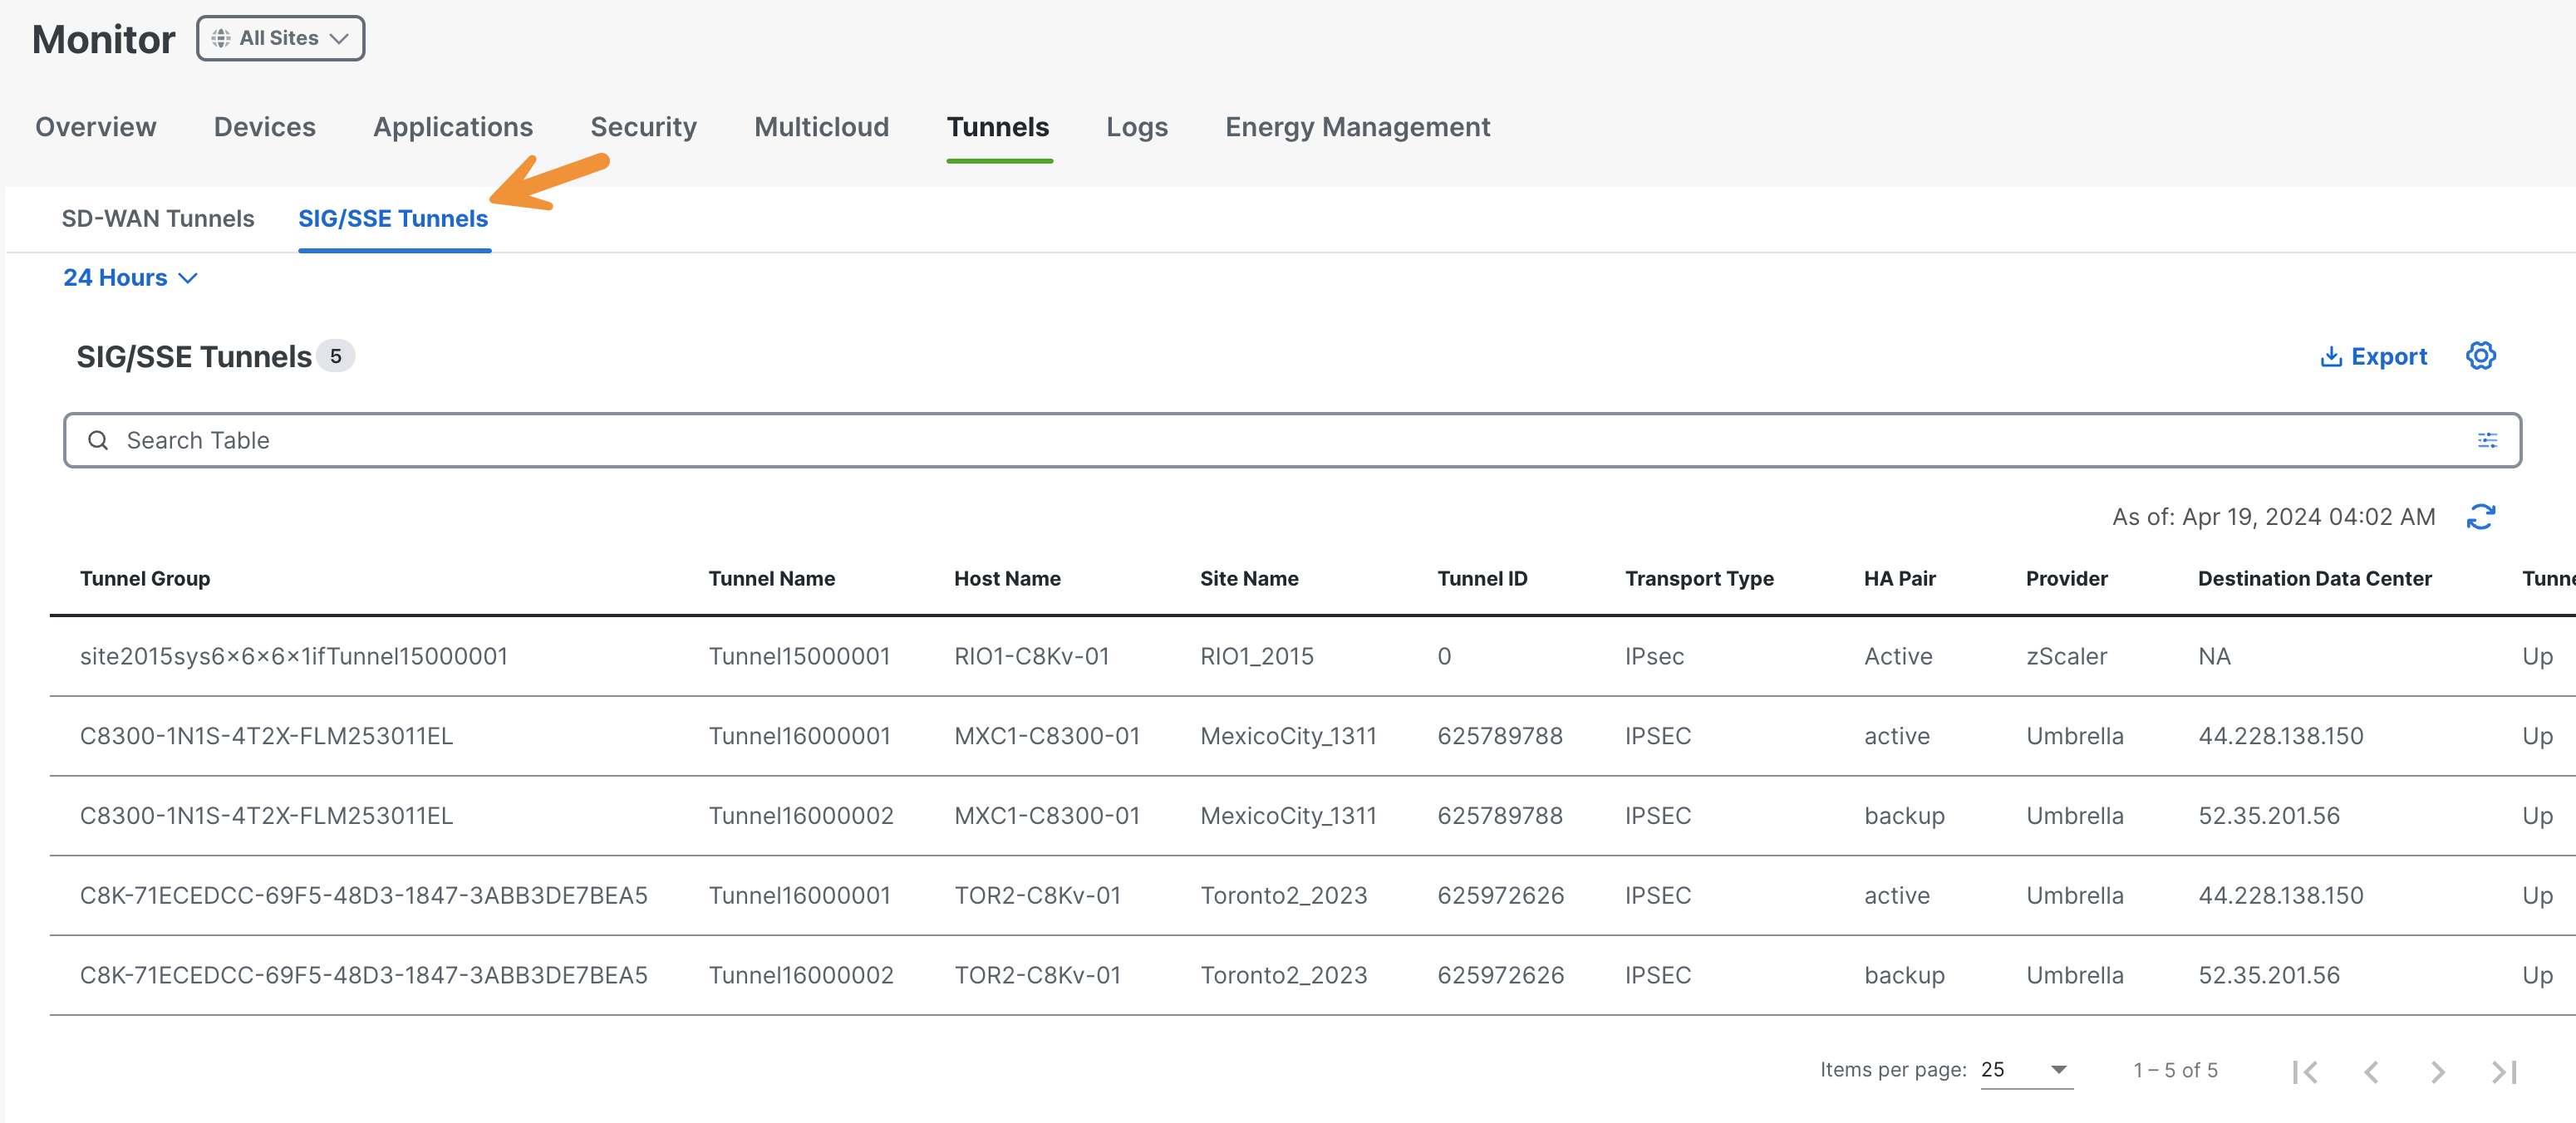
After closing the panel, take a moment to review the graph located under SIG/SSE Tunnels. Then click on All SIG/SSE Tunnels.
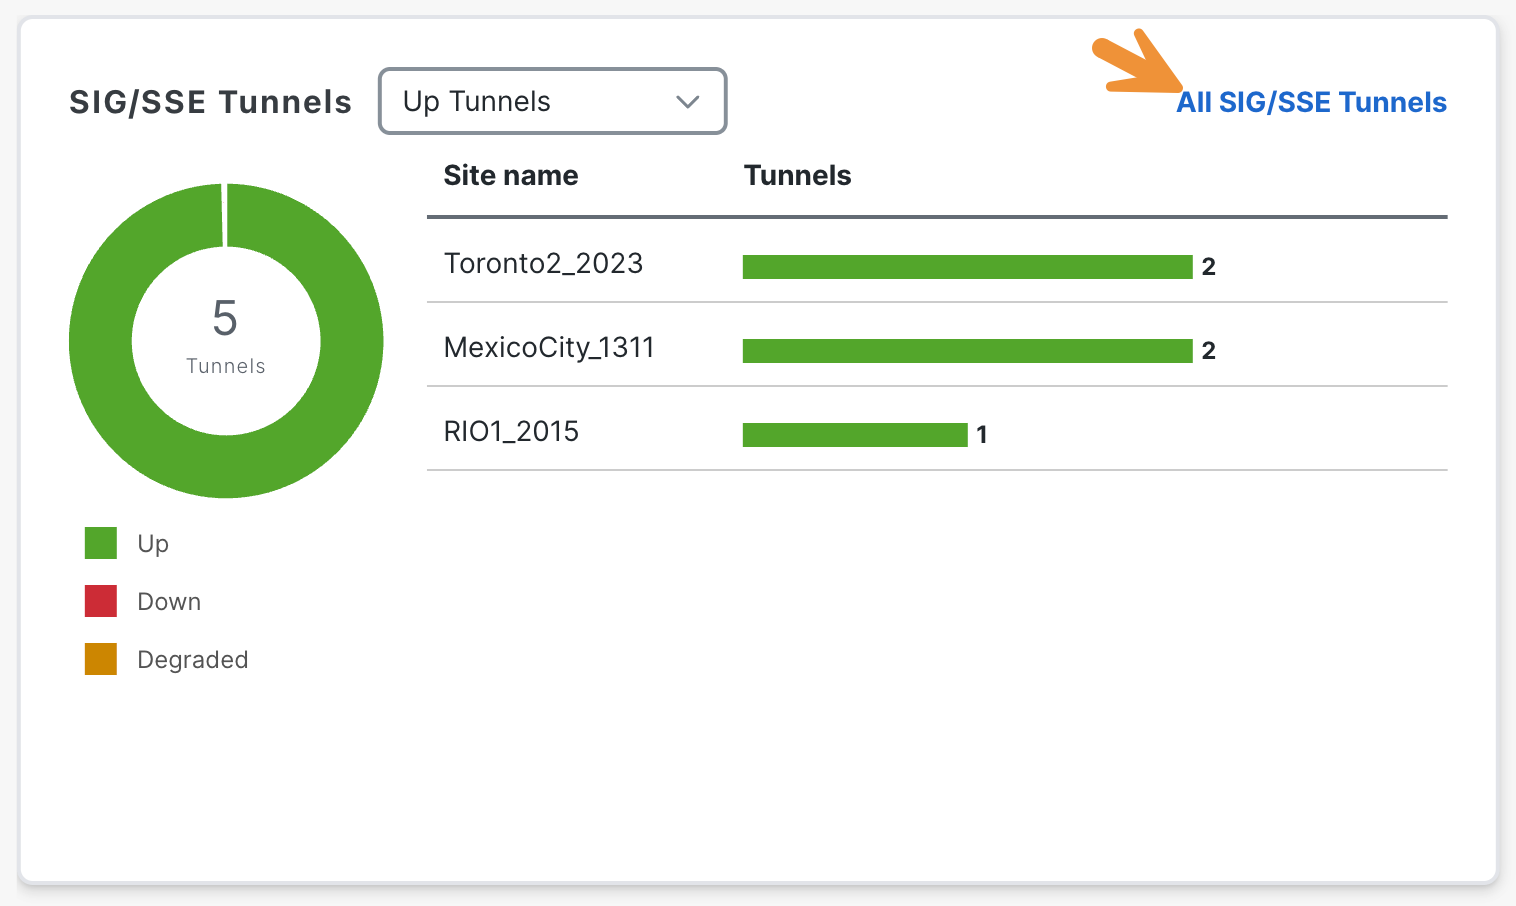
A comprehensive list of the currently configured tunnels for SIG/SSE will be displayed.
To return to the security dashboard landing page, click on Security.
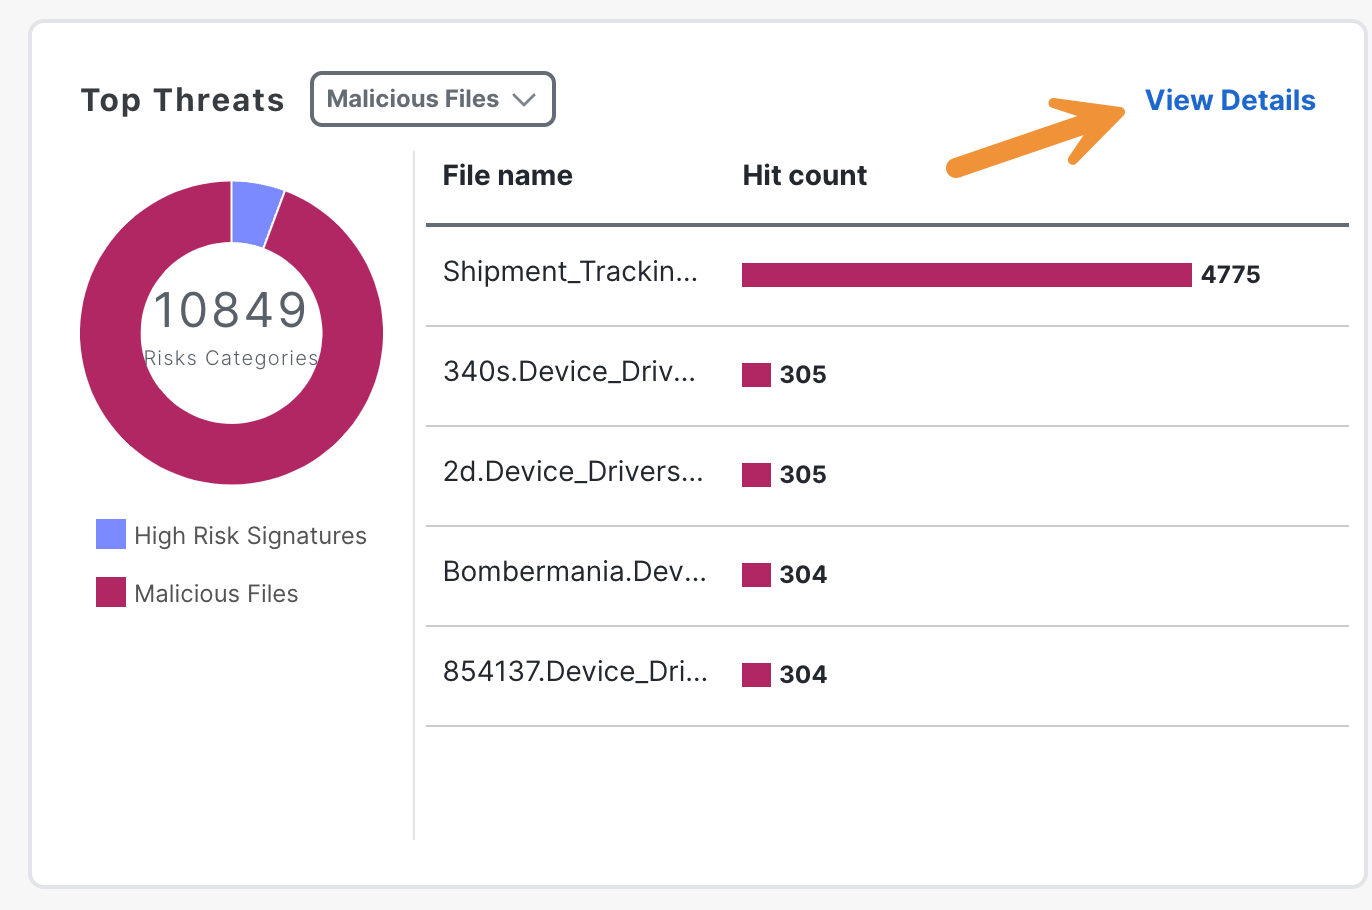
Hover over the graph in the Top Threats section to explore the types of threats being identified.
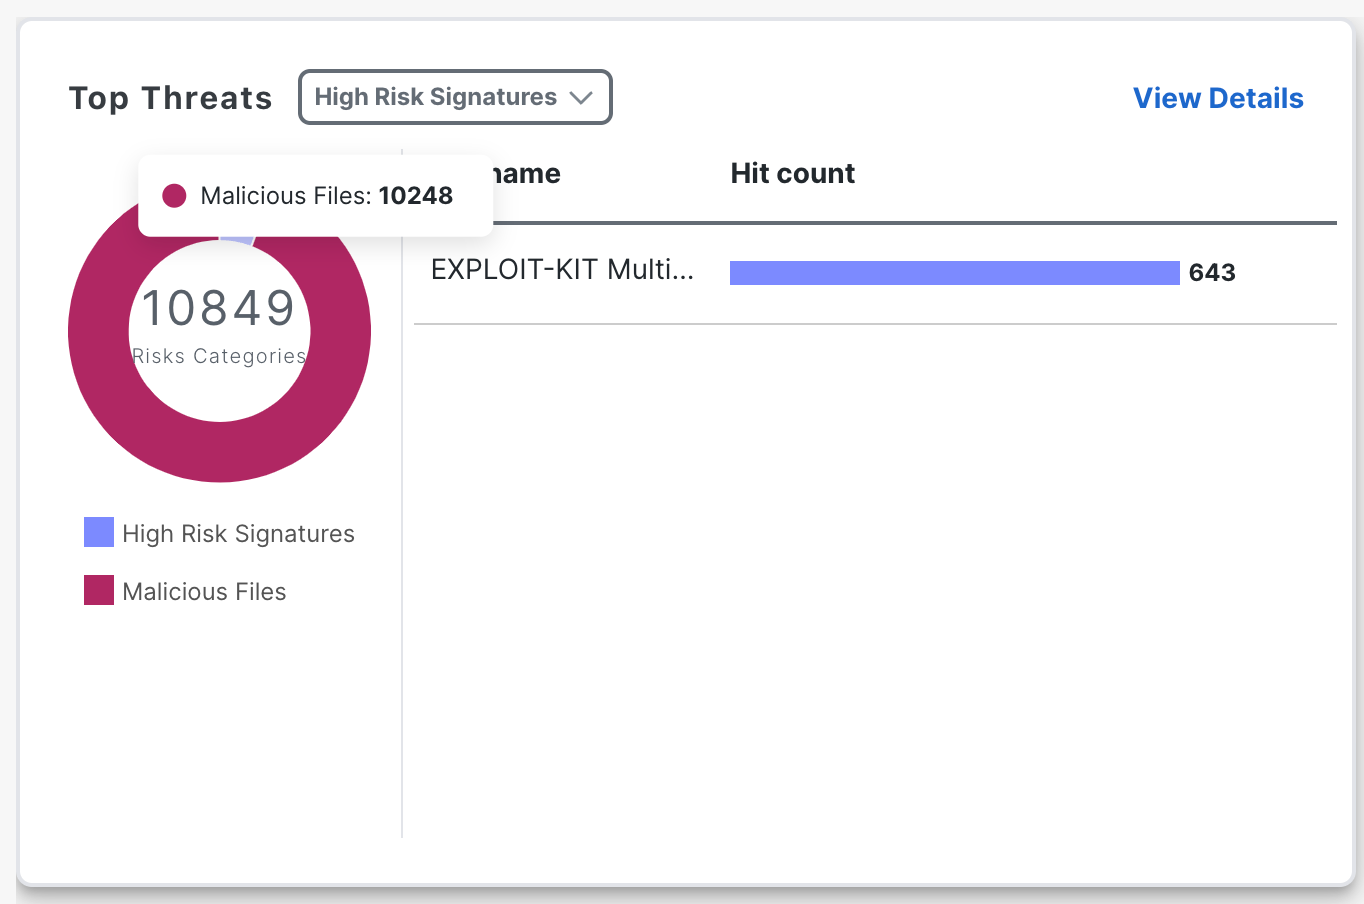
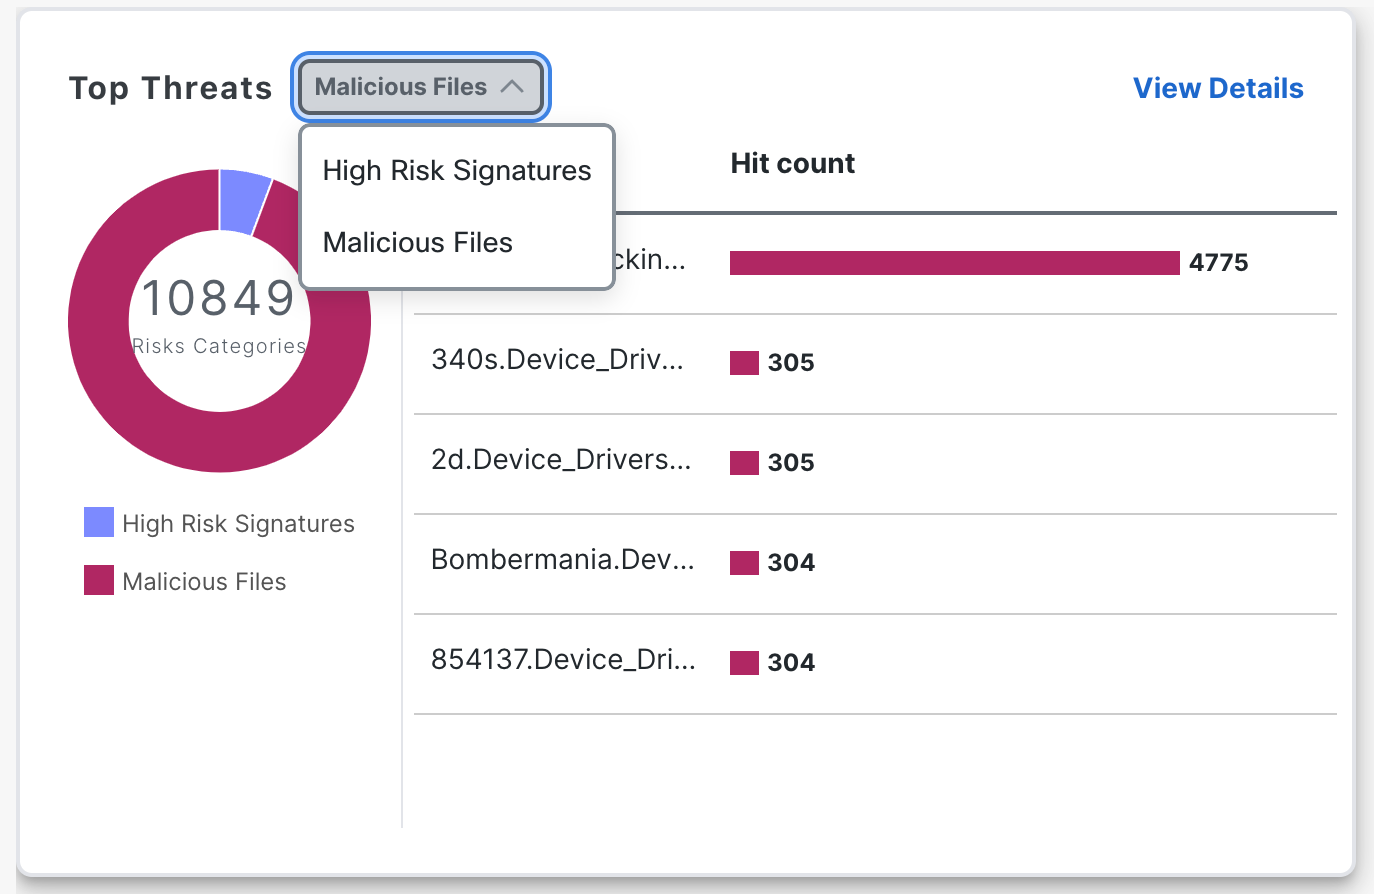
From the menu, you can select and explore the types of threats, such as High Risk Signatures or Malicious Files.
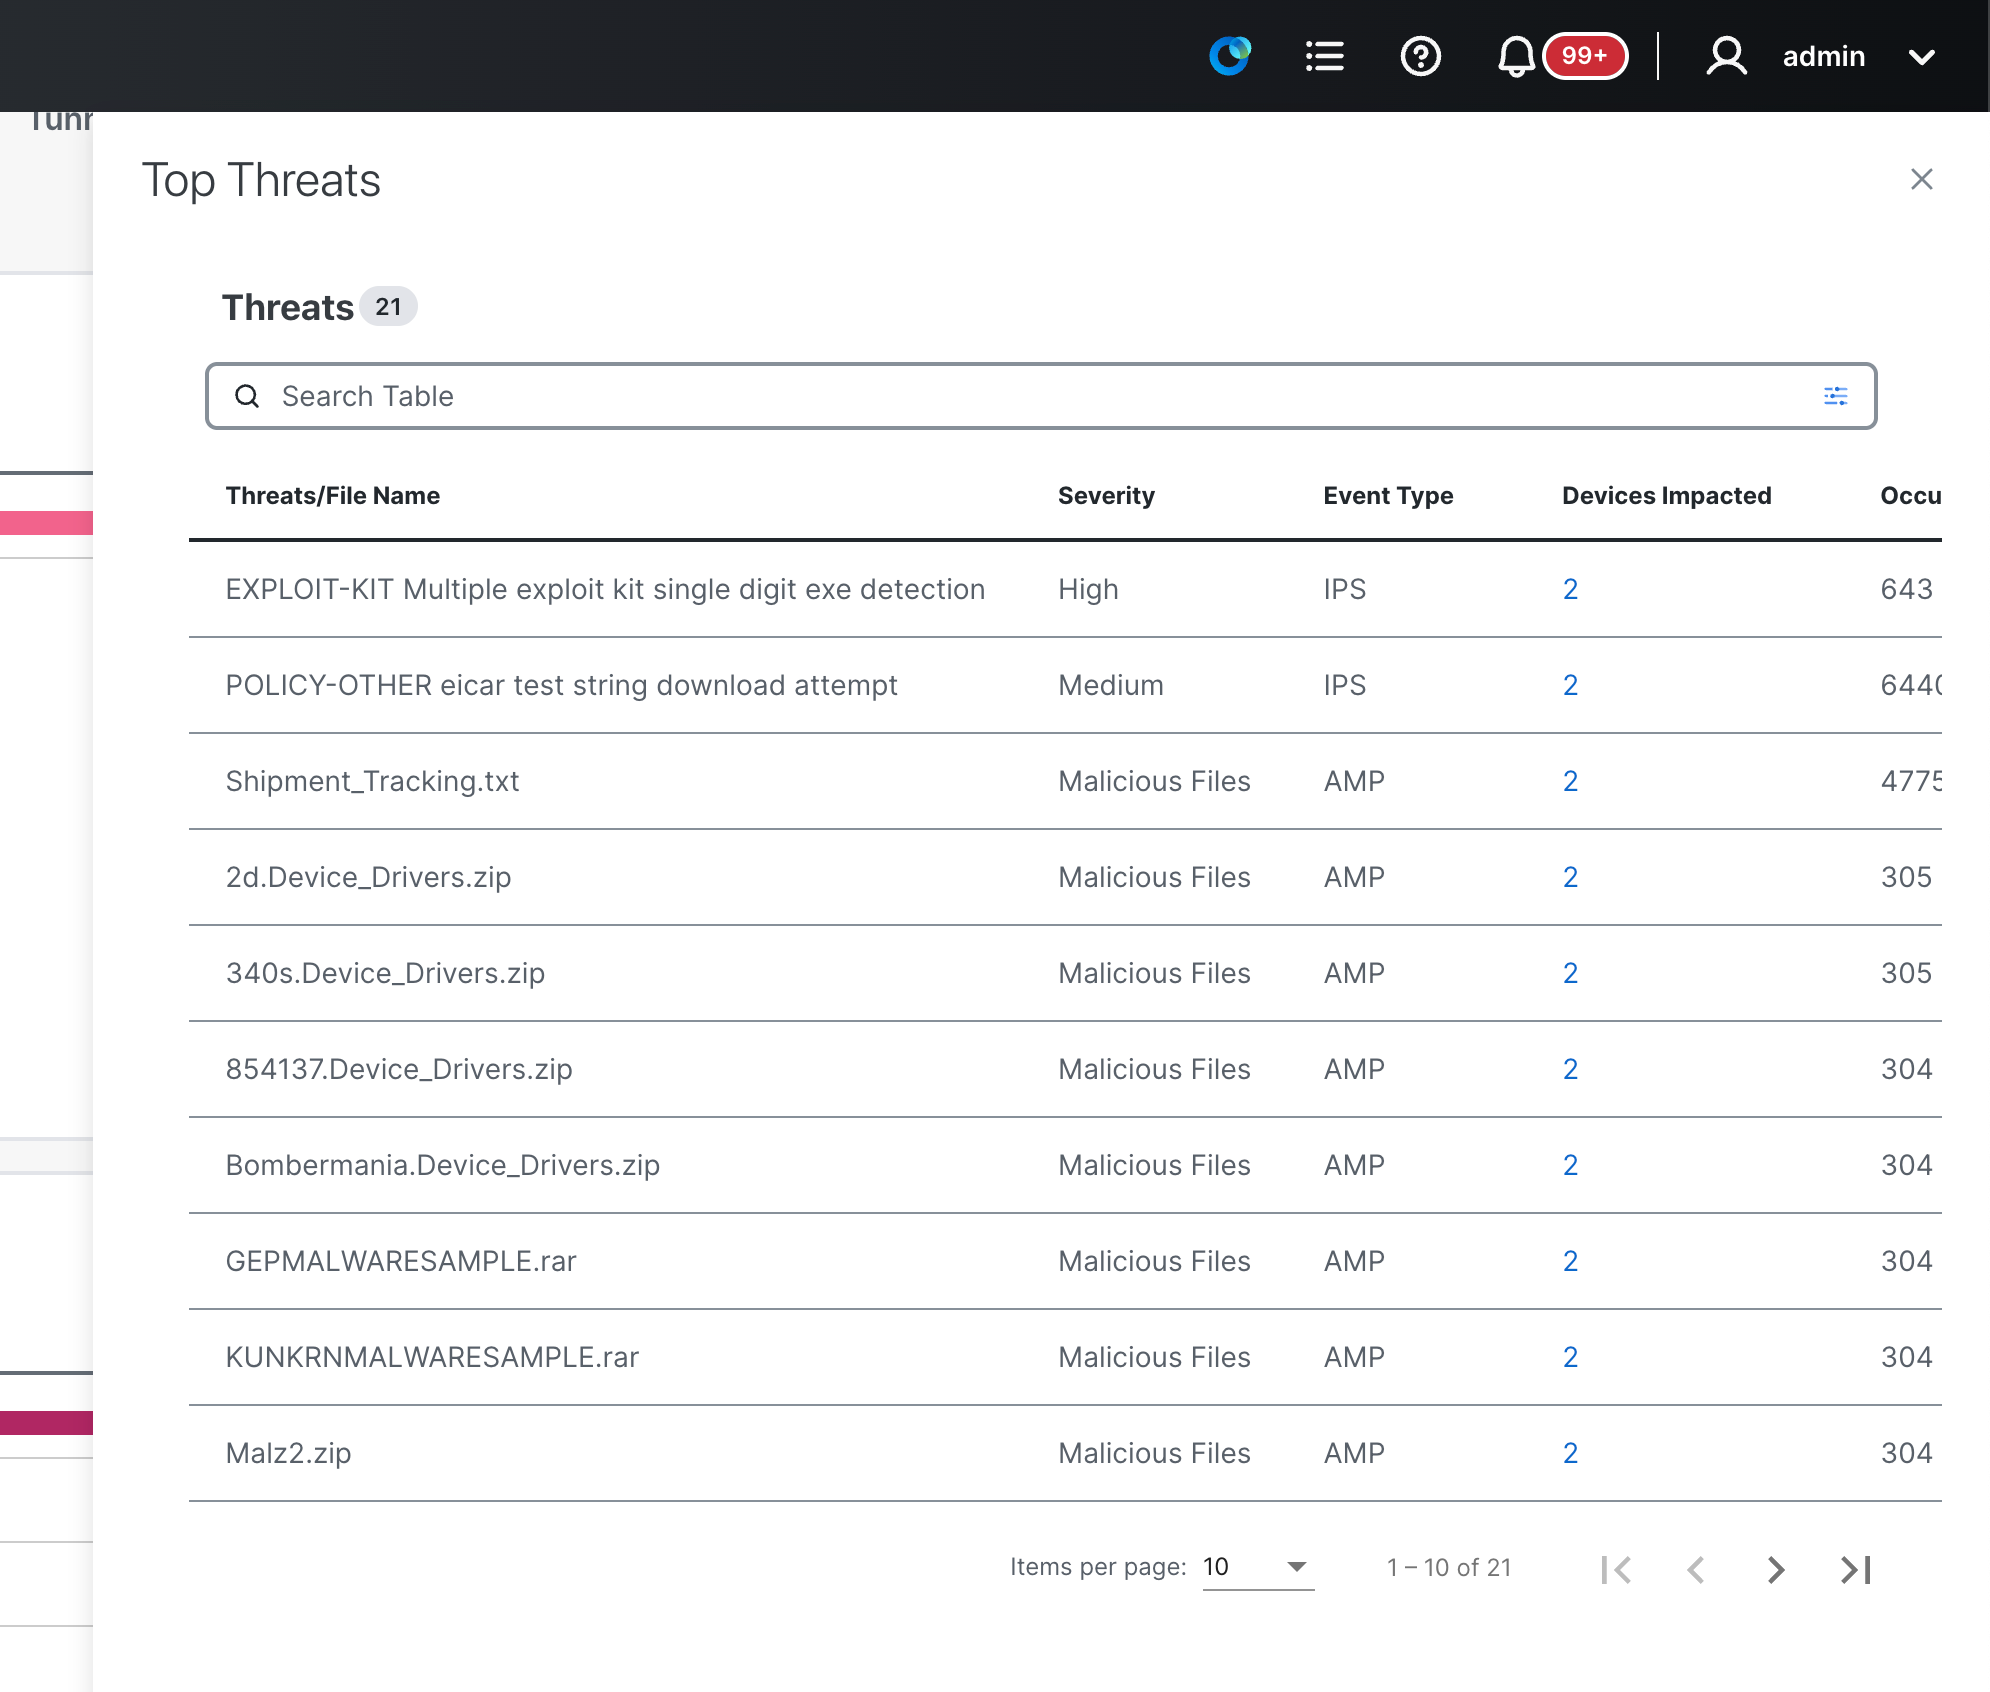
Click on View Details.
In the slide-out panel that appears, you will find a list containing the names of the threats/files, the severity, the event type, occurrences, and more.
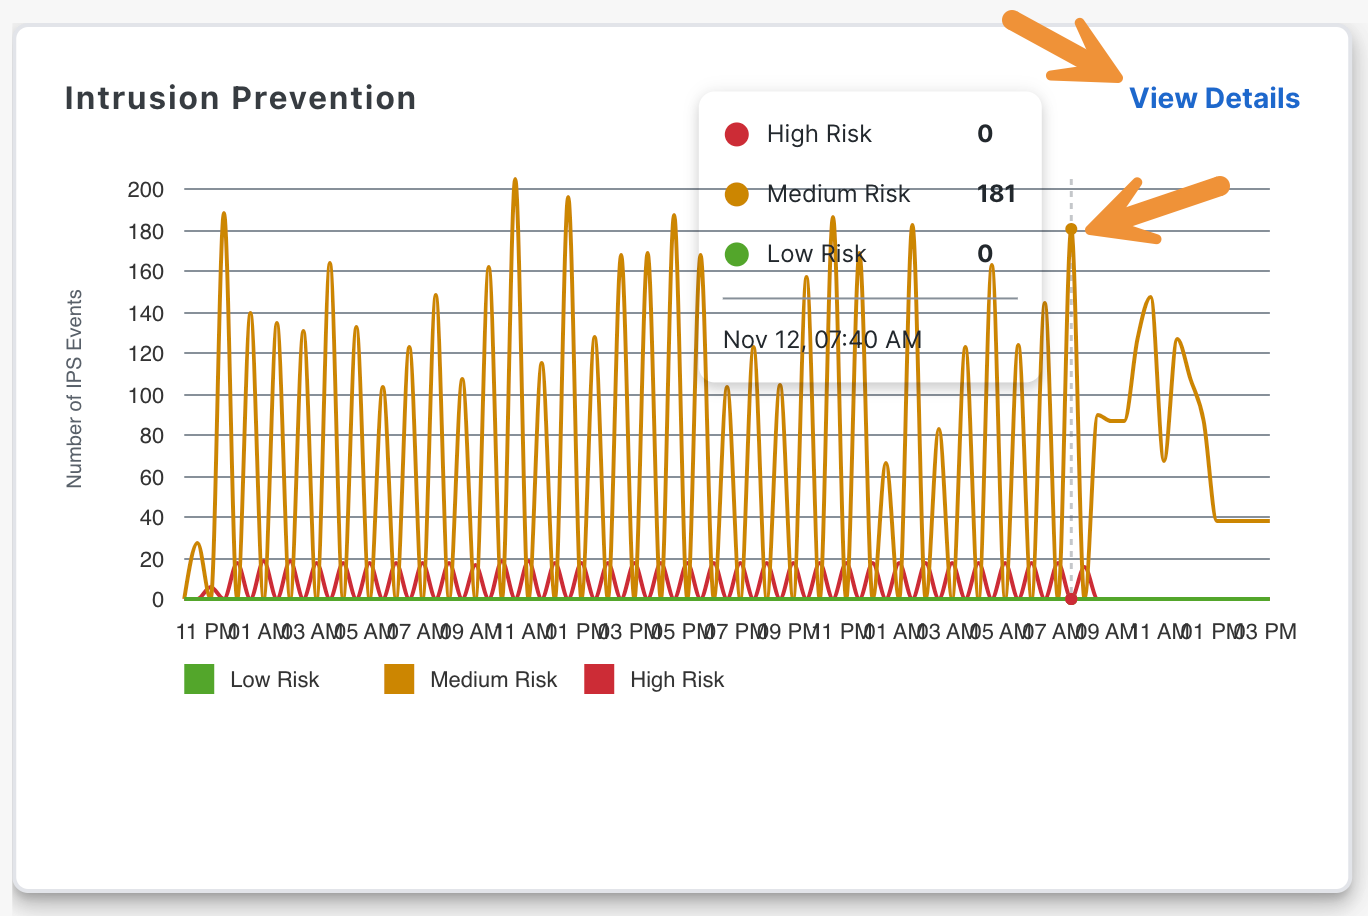
After closing the panel, take a moment to review the graph located under Intrusion Prevention. Then, click on View Details.
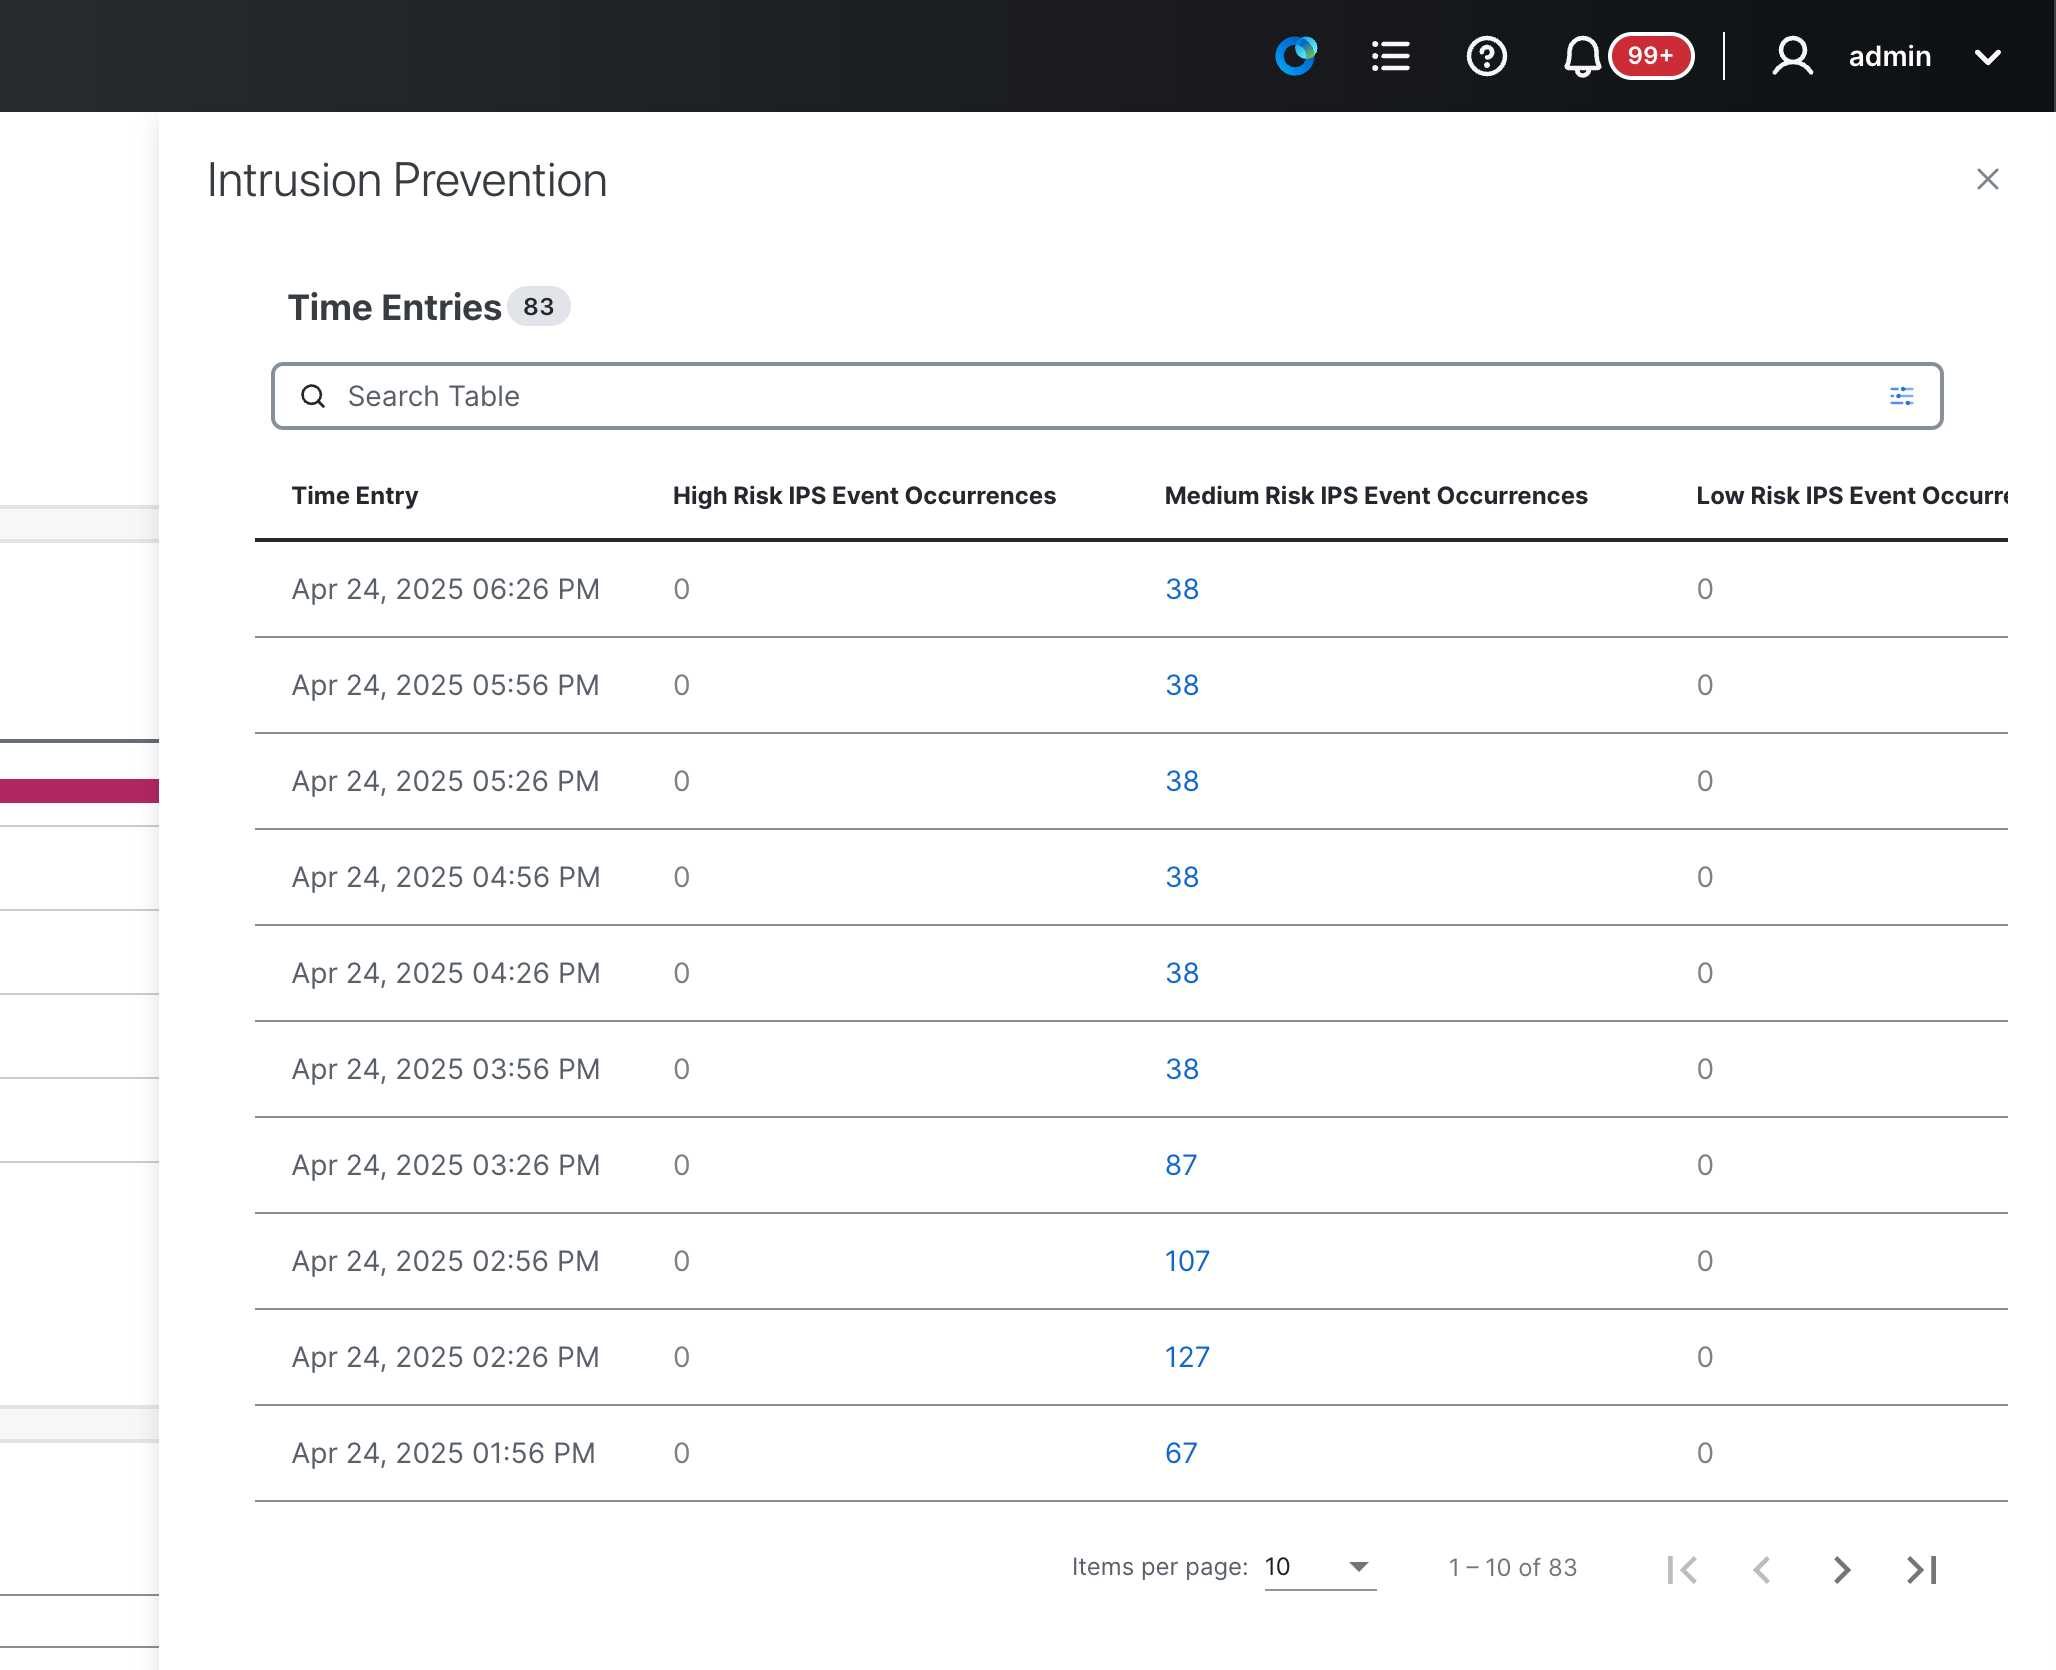
In the slide-out panel that appears, you will find a list containing the details of the entries, such as the severity and timestamps.
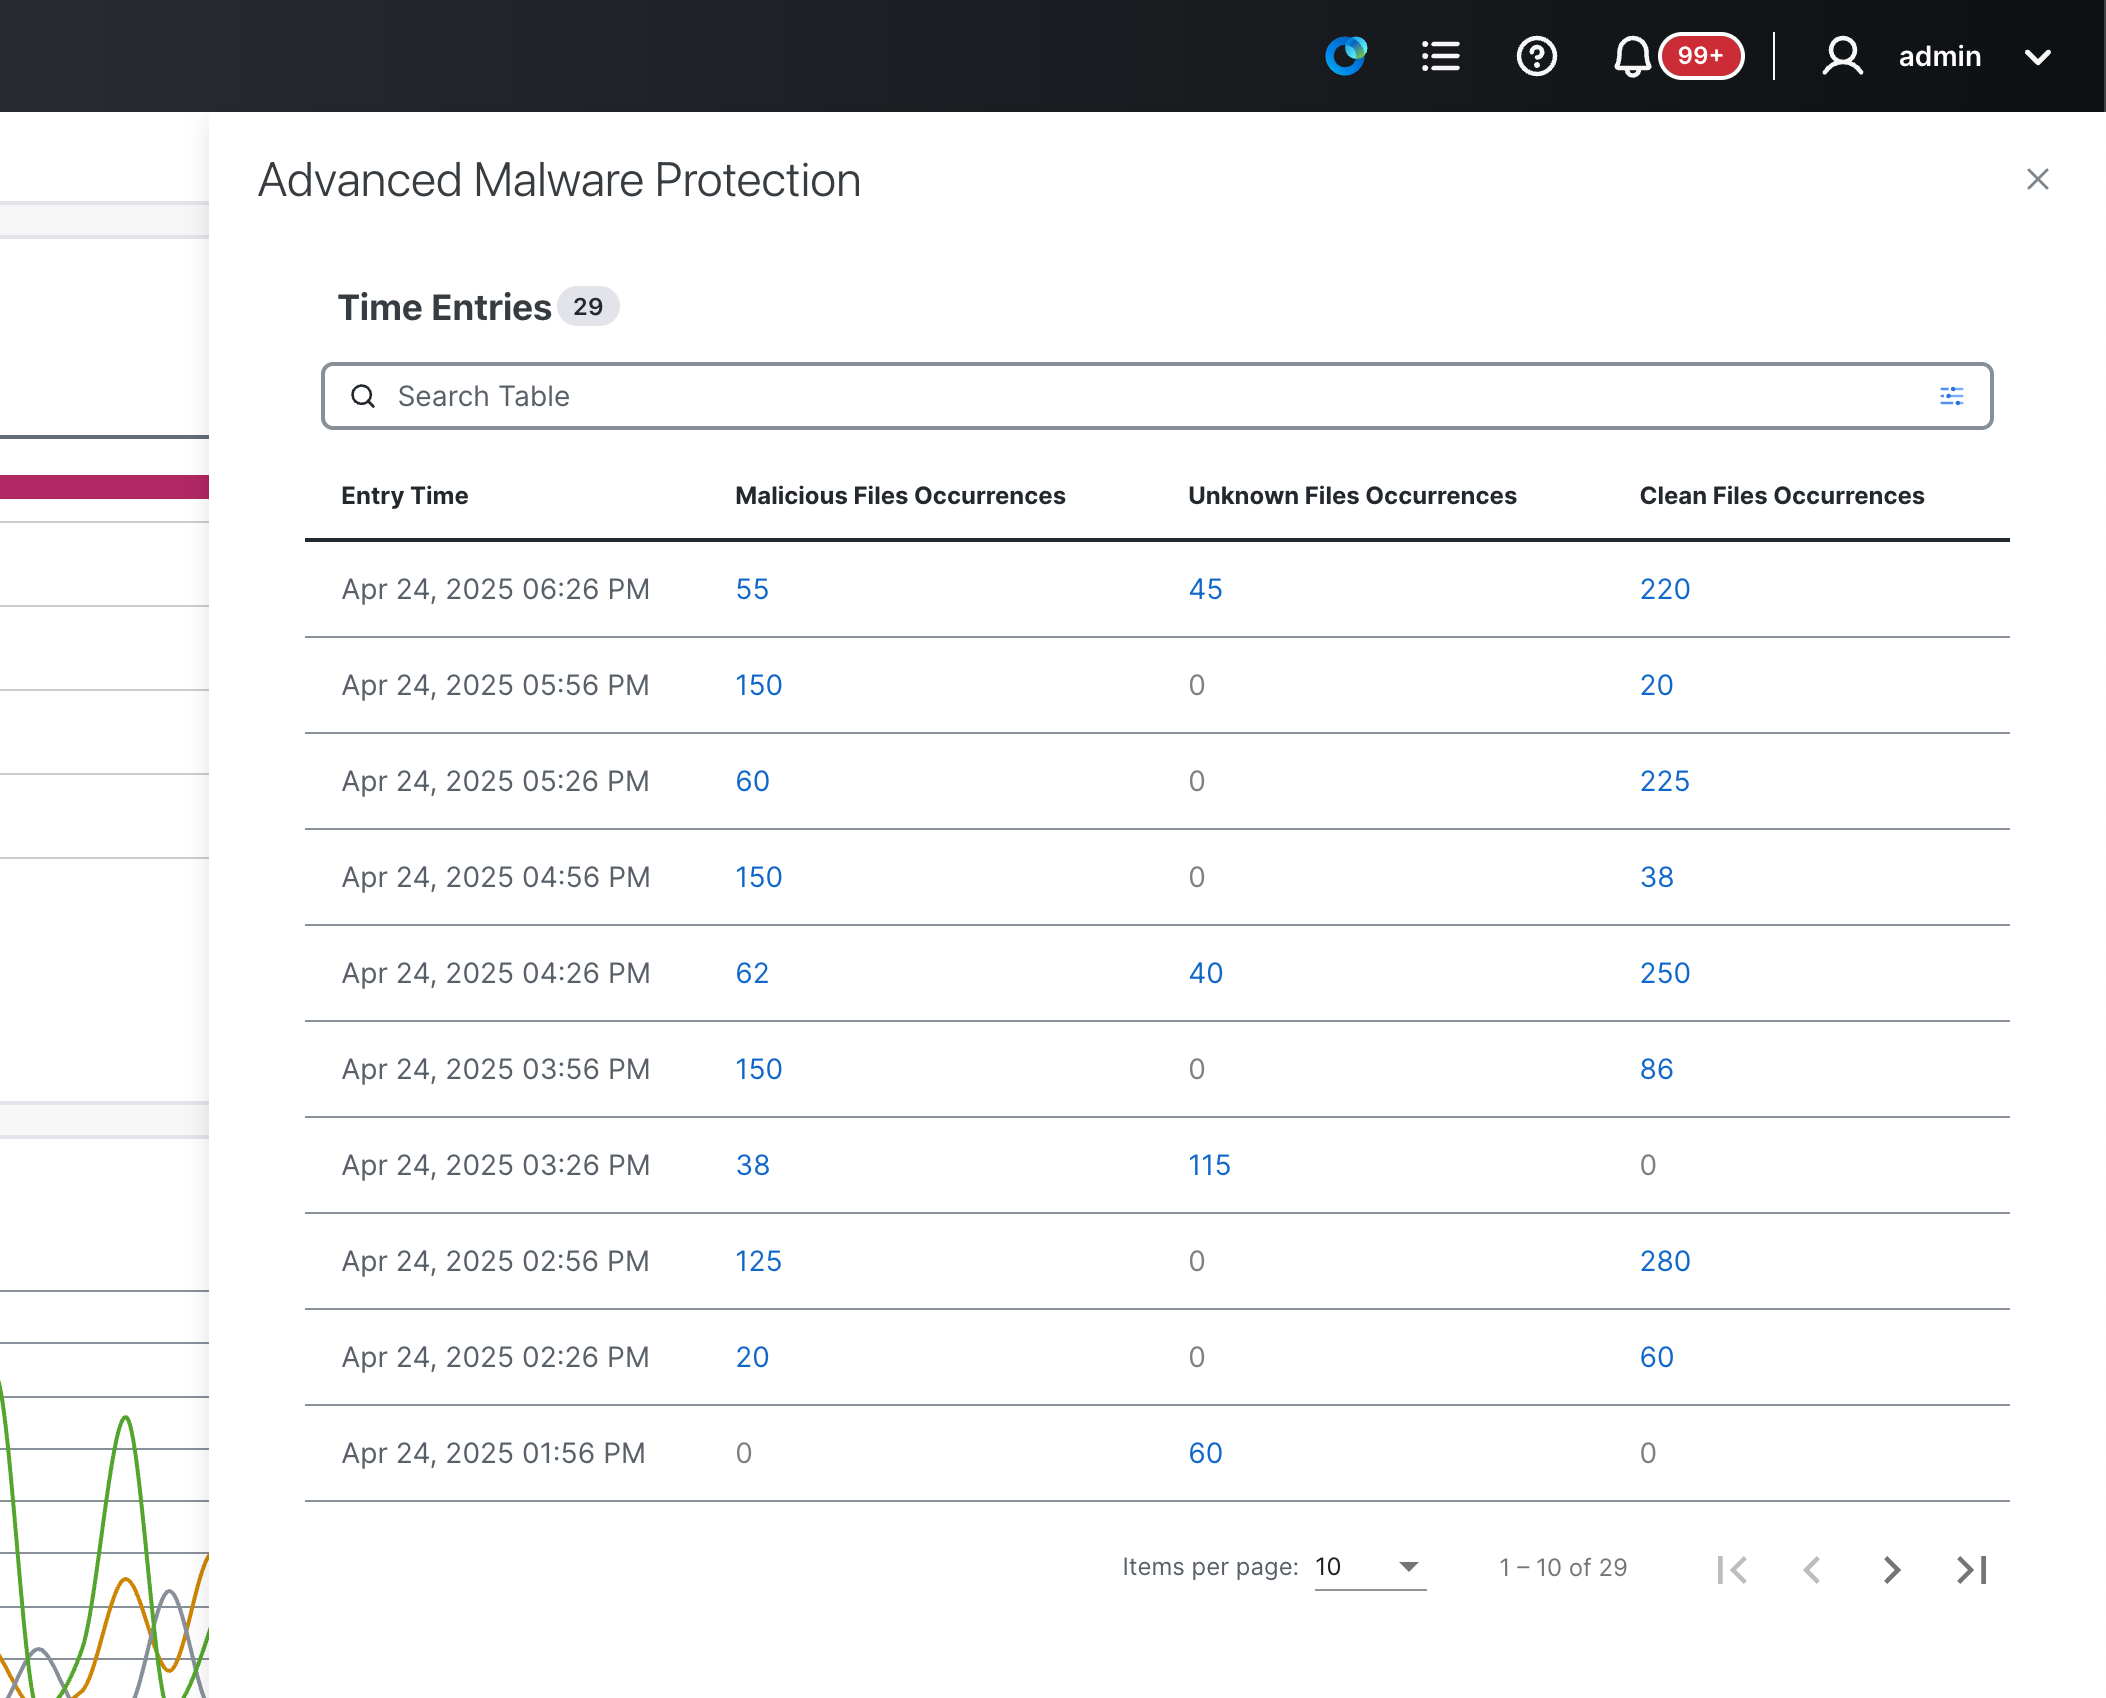
After closing the panel, take a moment to review the graph located under Advanced Malware Protection. Then, click on View Details.
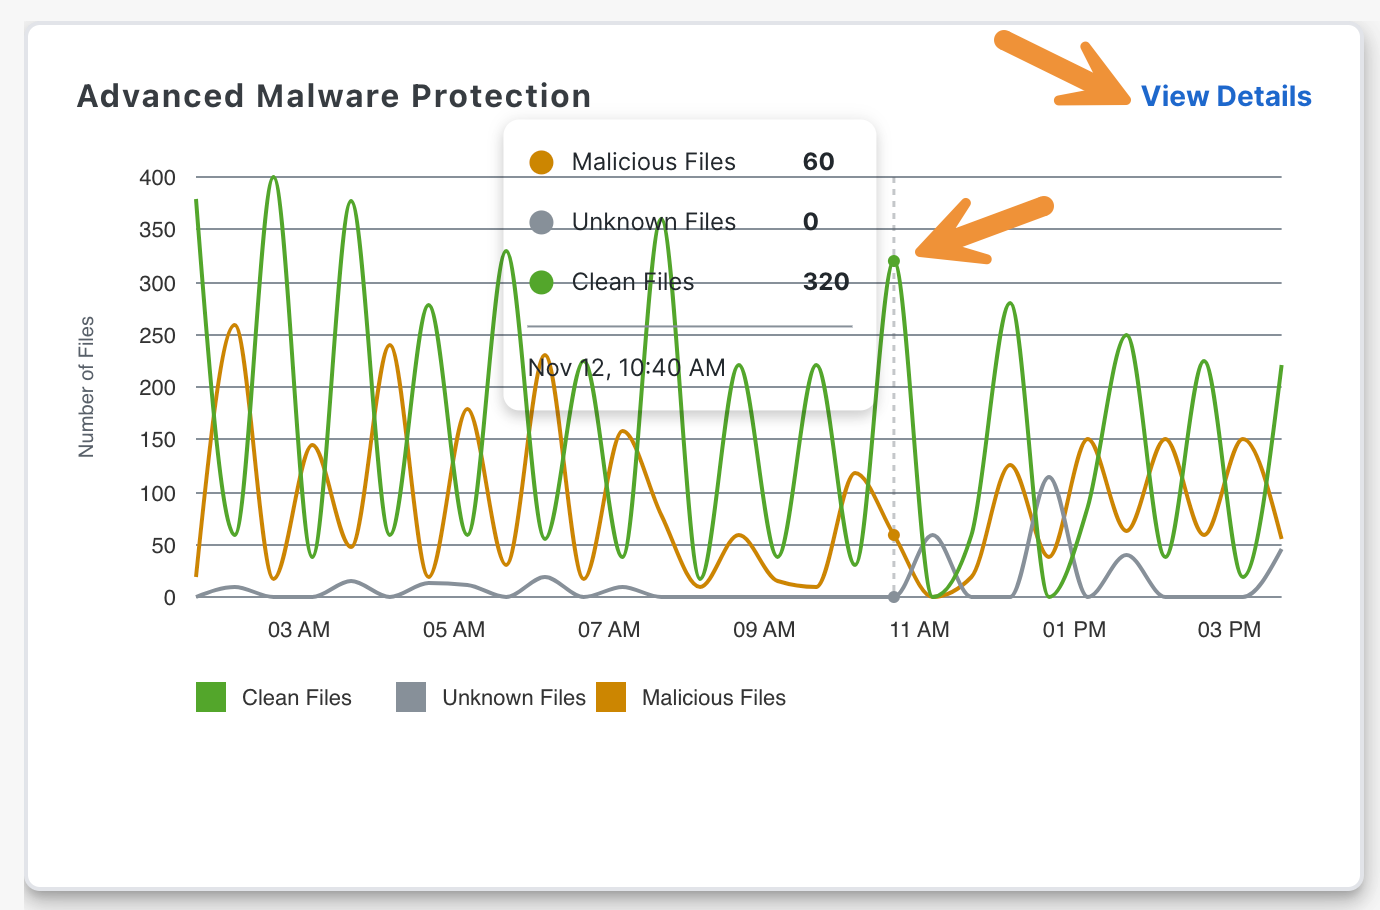
In the slide-out panel that appears, you will find a list containing the details of the entries, whether they are malicious, unknown or clean.
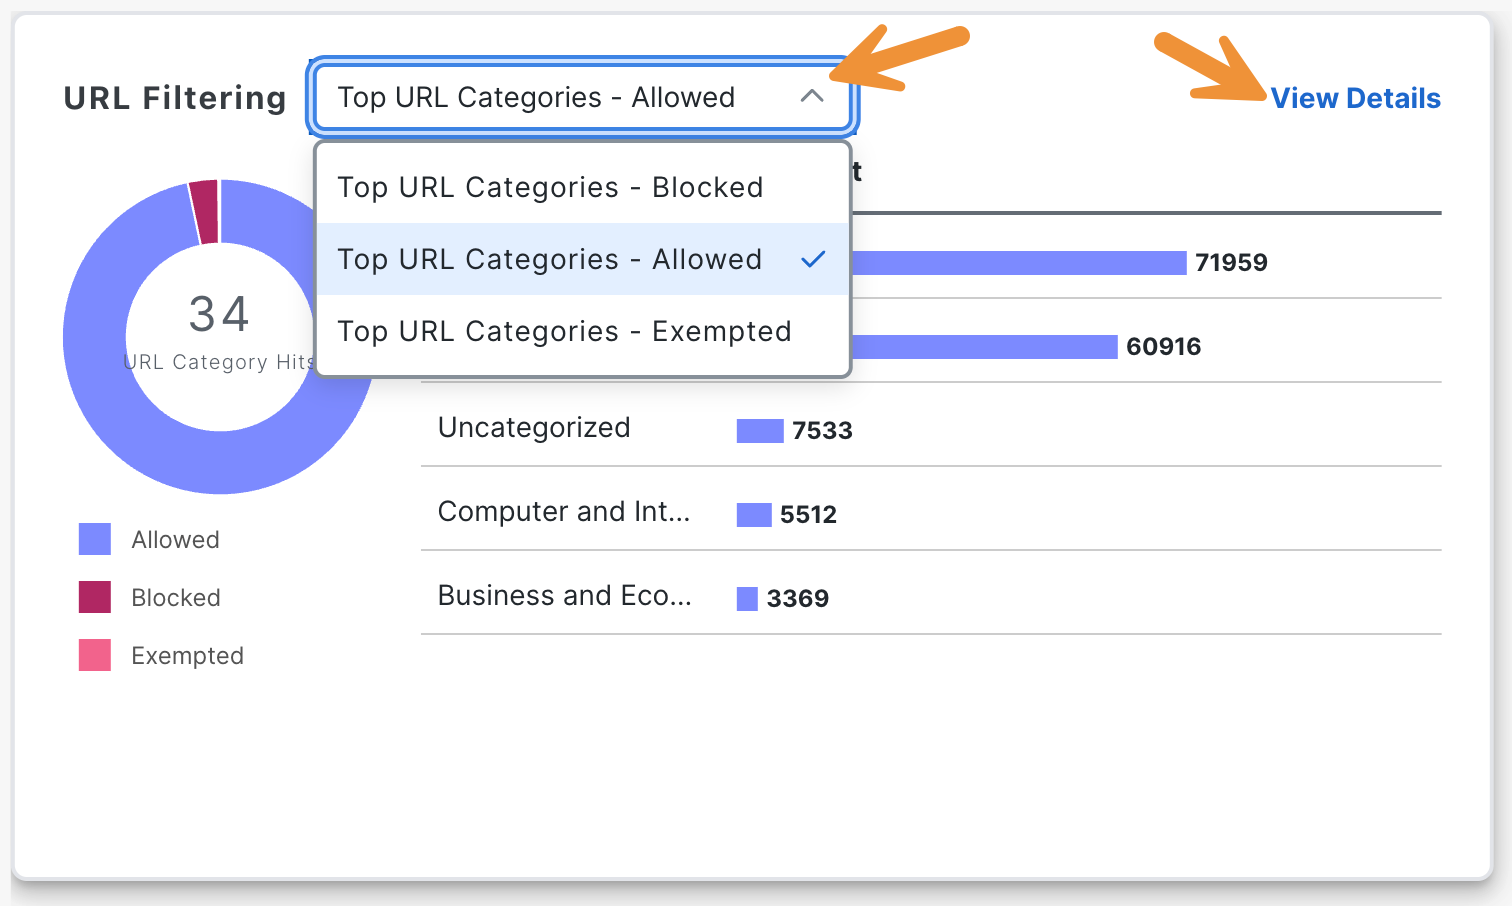
After closing the panel, hover over the graph in the URL Filtering section to explore the number of hits for traffic that is being allowed, blocked or exempted.
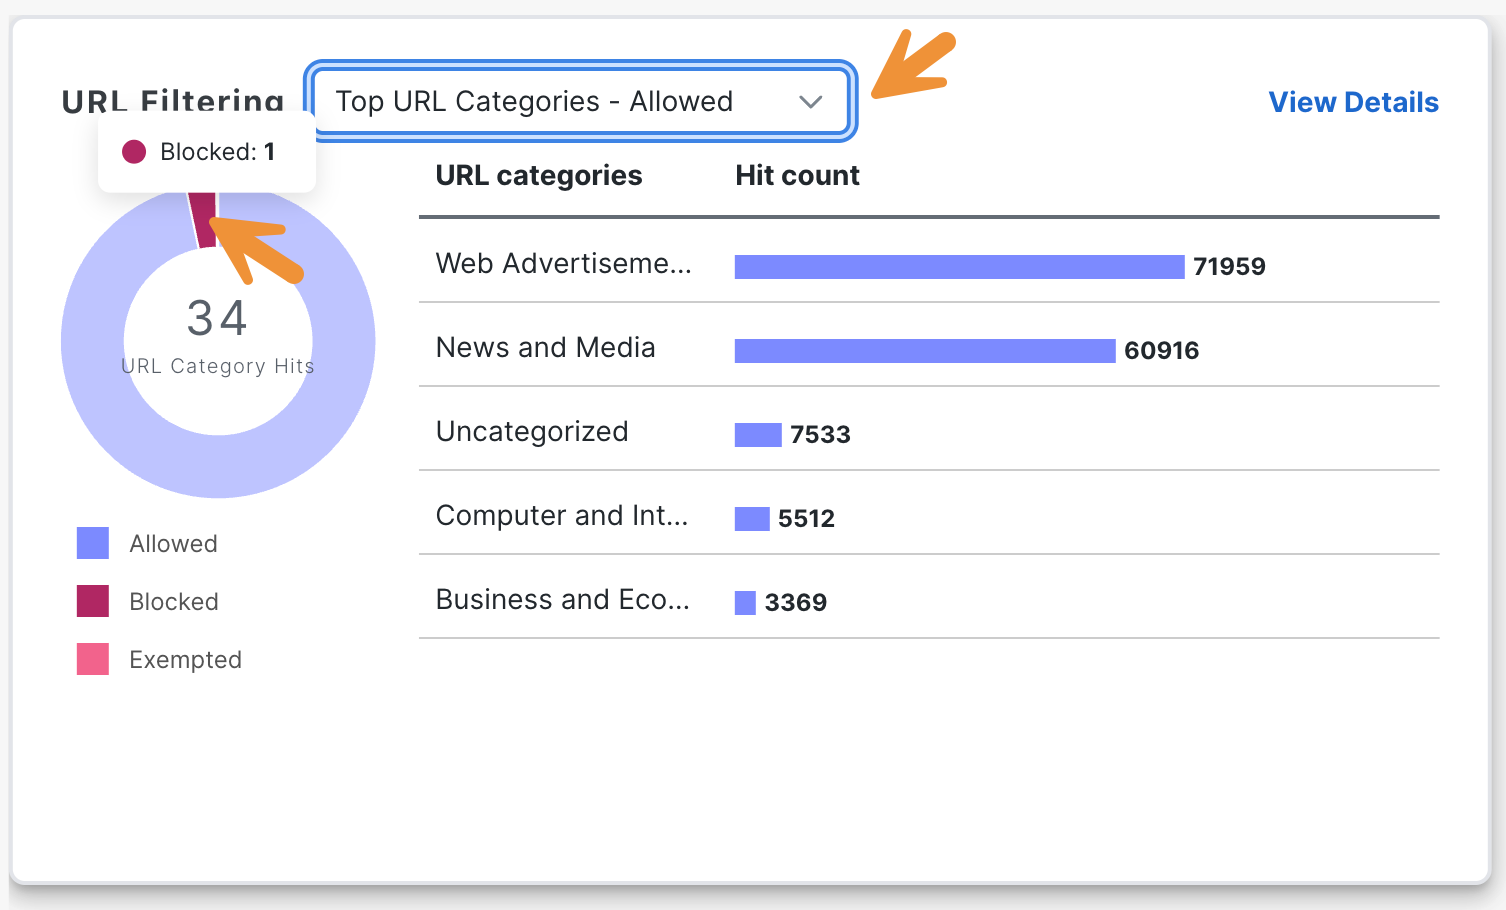
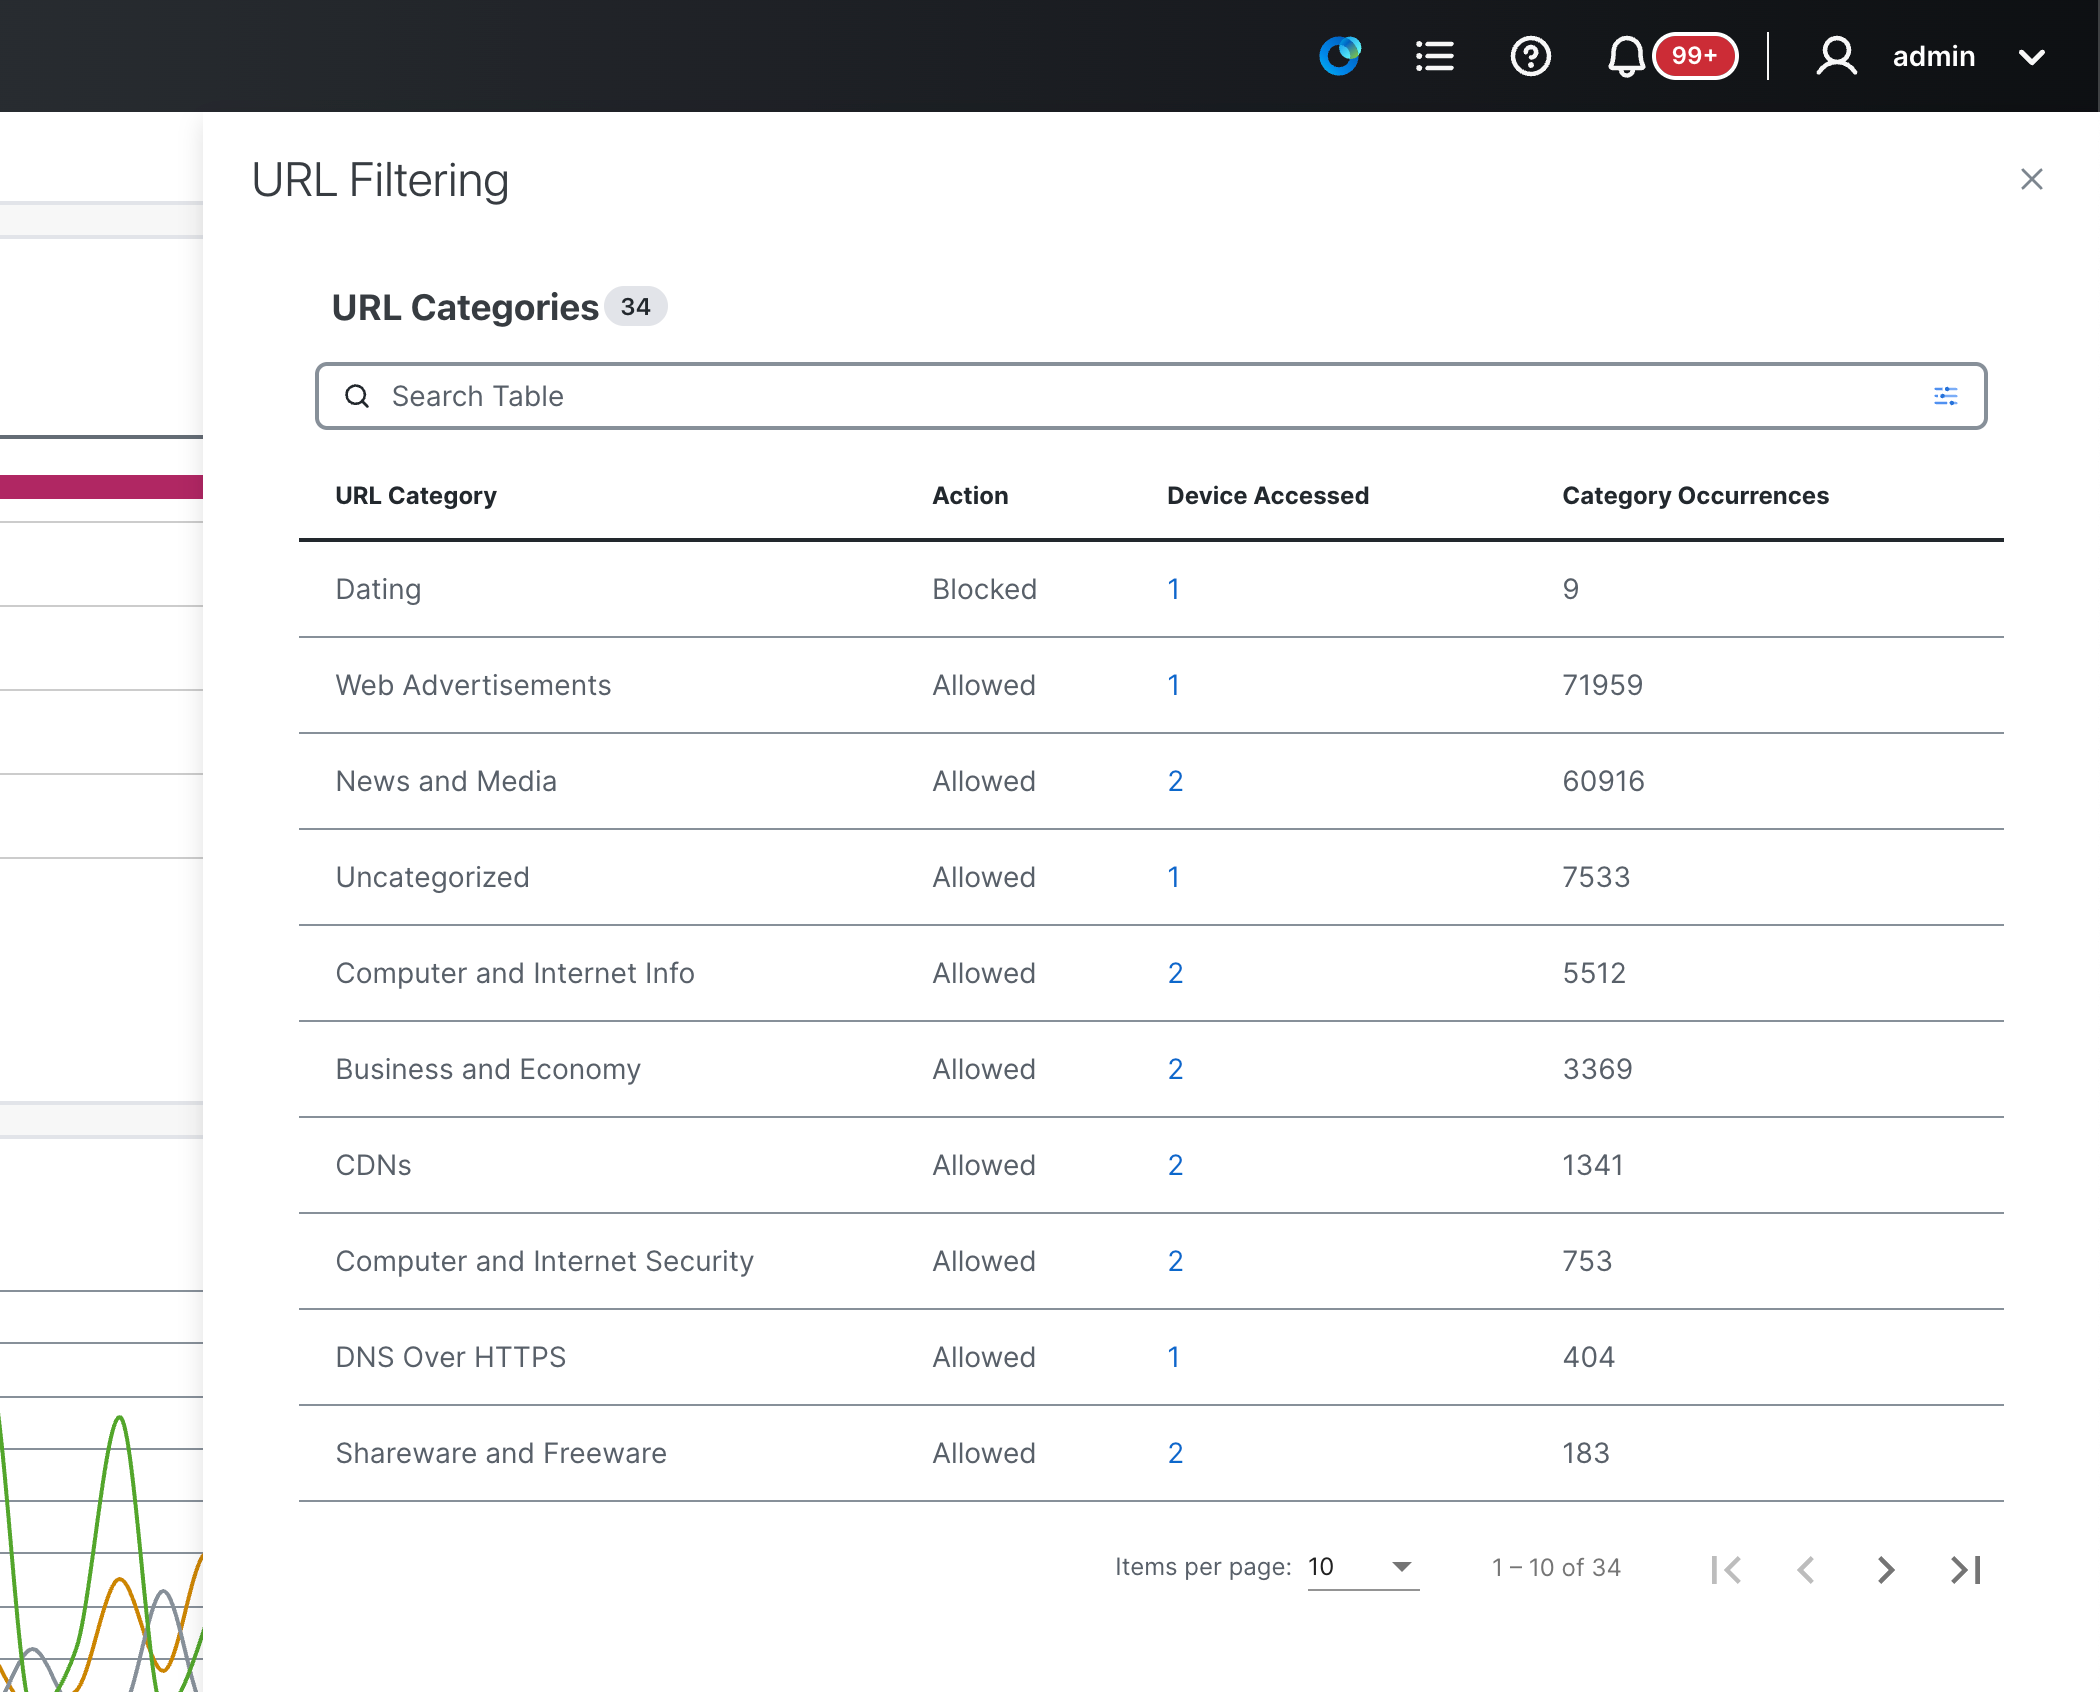
From the menu, you can select and filter by the URL categories. Then, click on View Details.
In the slide-out panel that appears, you will find a list containing the details of the URL categories, including the action taken and the number of occurrences.
After closing the panel, click on the Logs tab.
Catalyst SD-WAN has an integrated logging capability.
The SD-WAN Manager offers centralized features to visualize threat alarms/events, providing granular details and the ability to export data for offline retention.
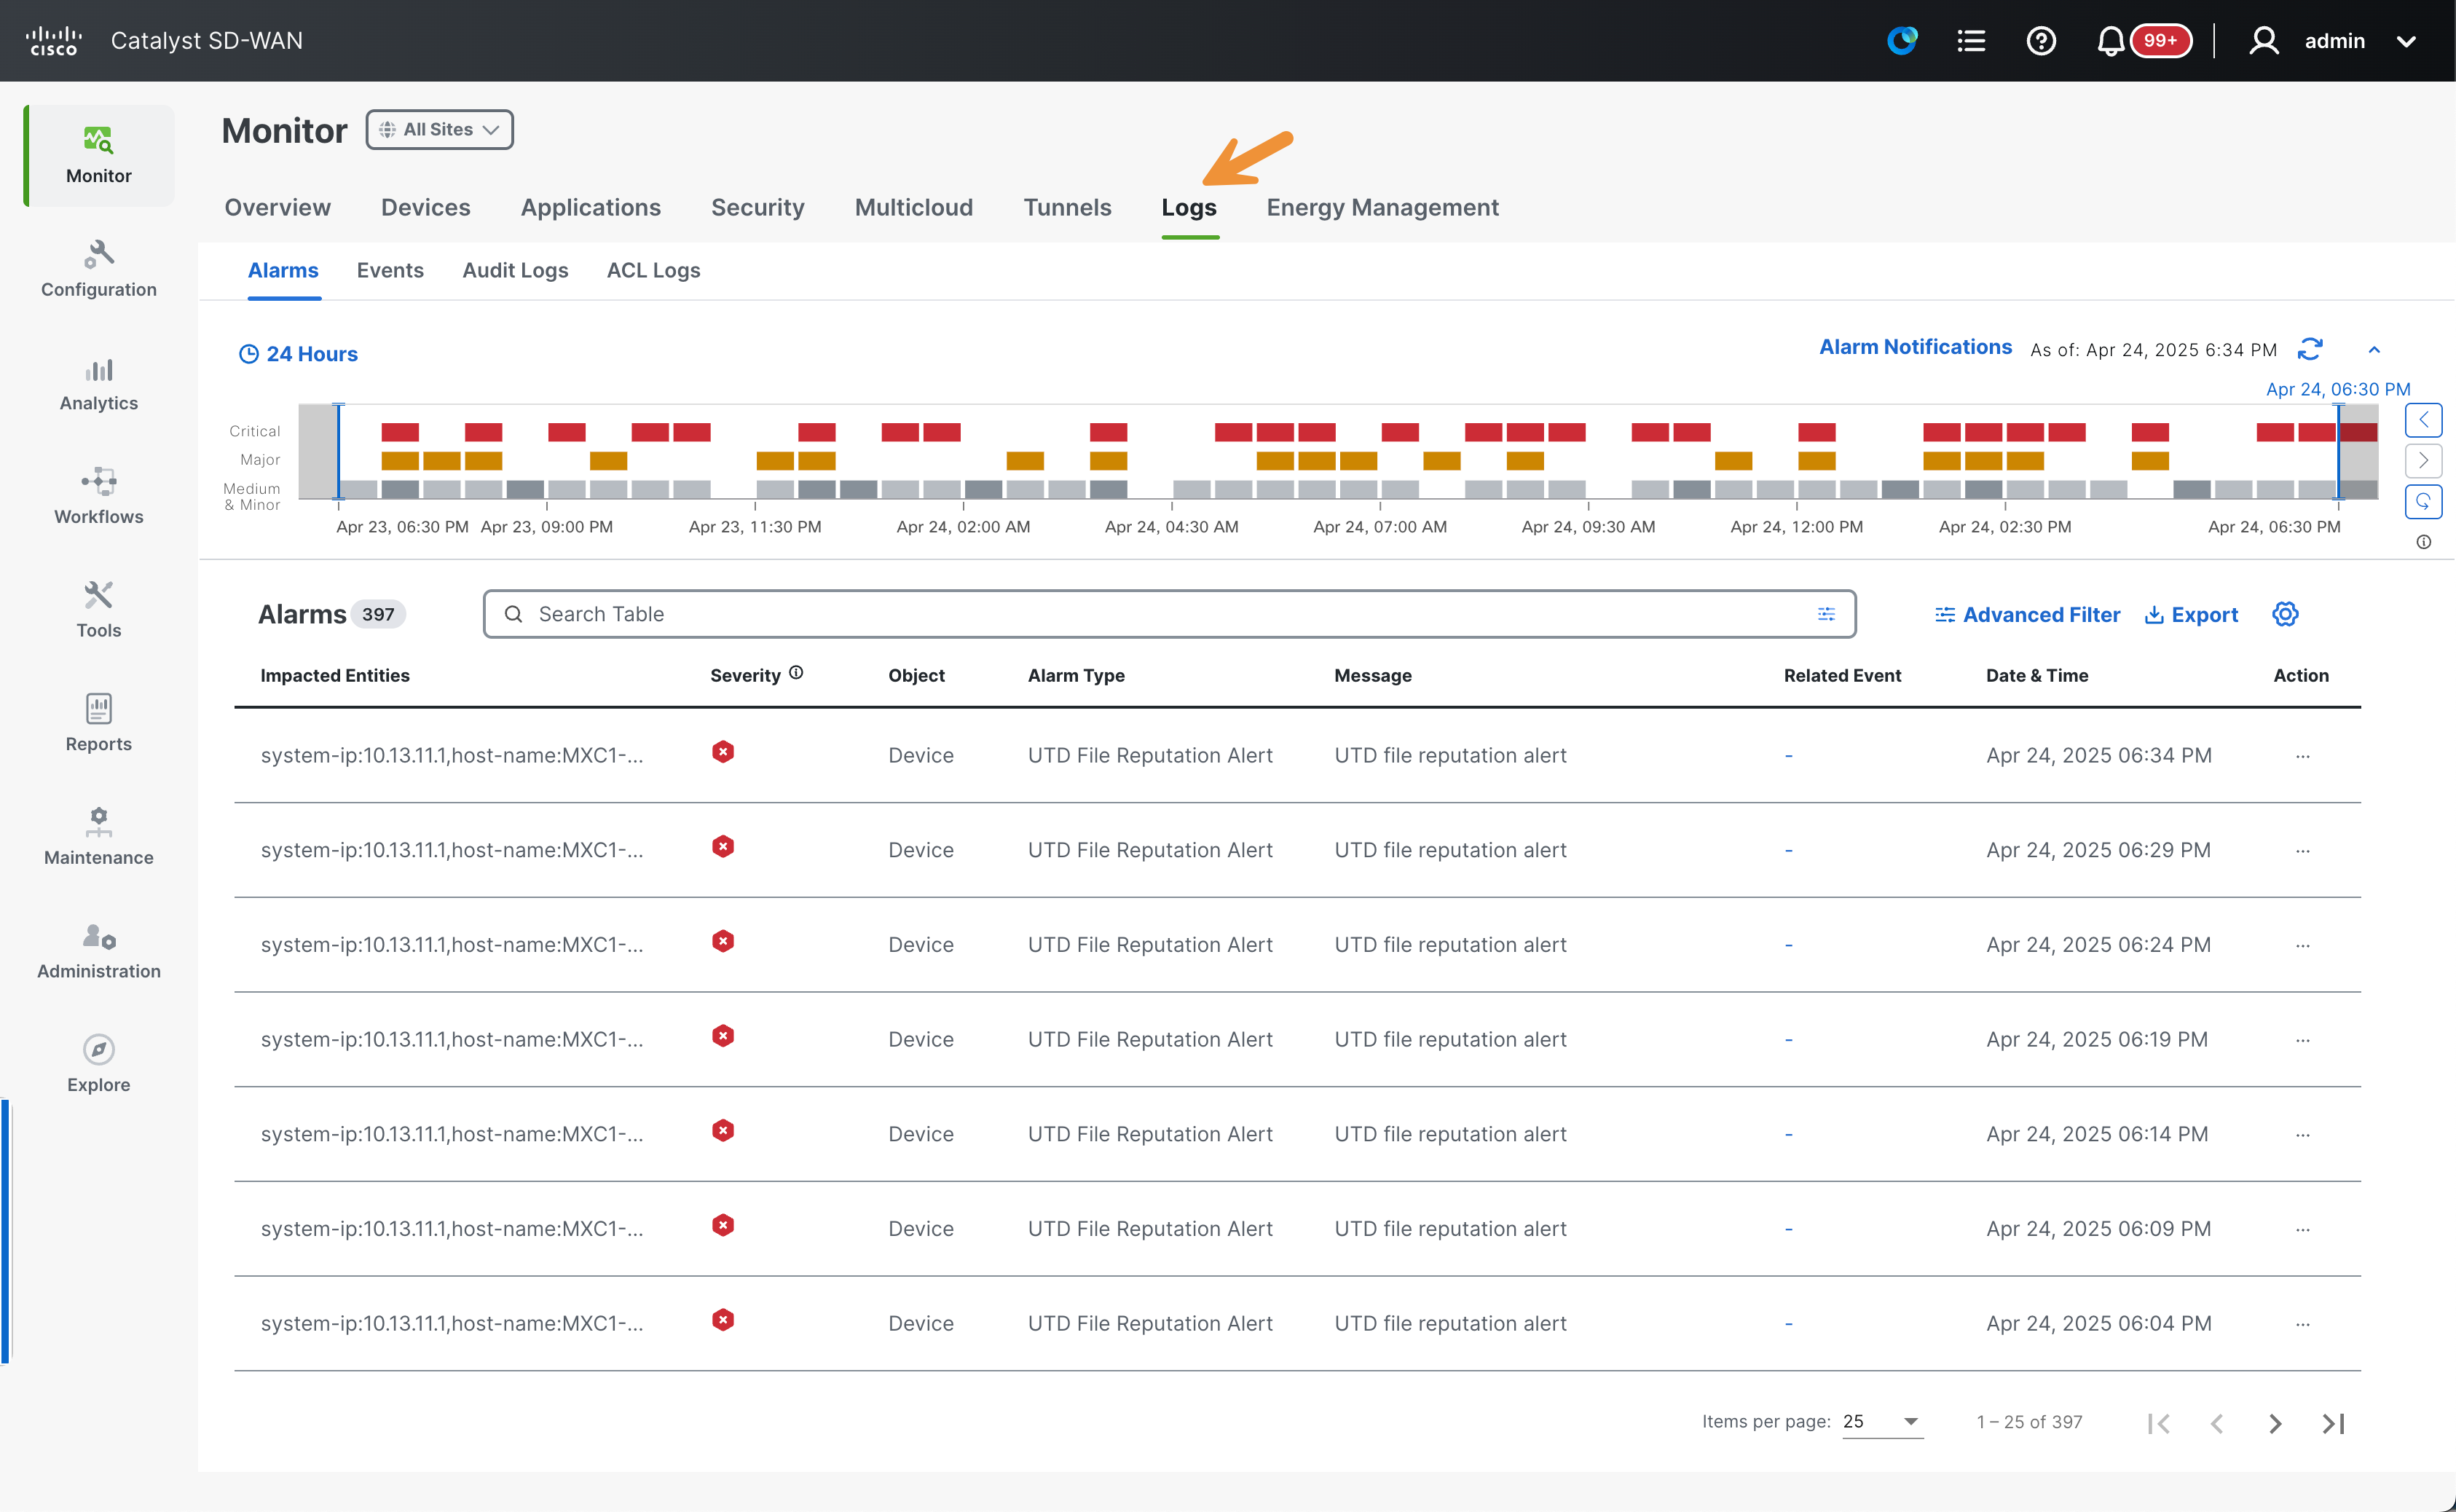
The Alarms tab will be the first one shown. Please select a timeslot in the last 24 hours to filter the alarms. Take note of the filtering mechanism by observing the actual alarm messages at the bottom.

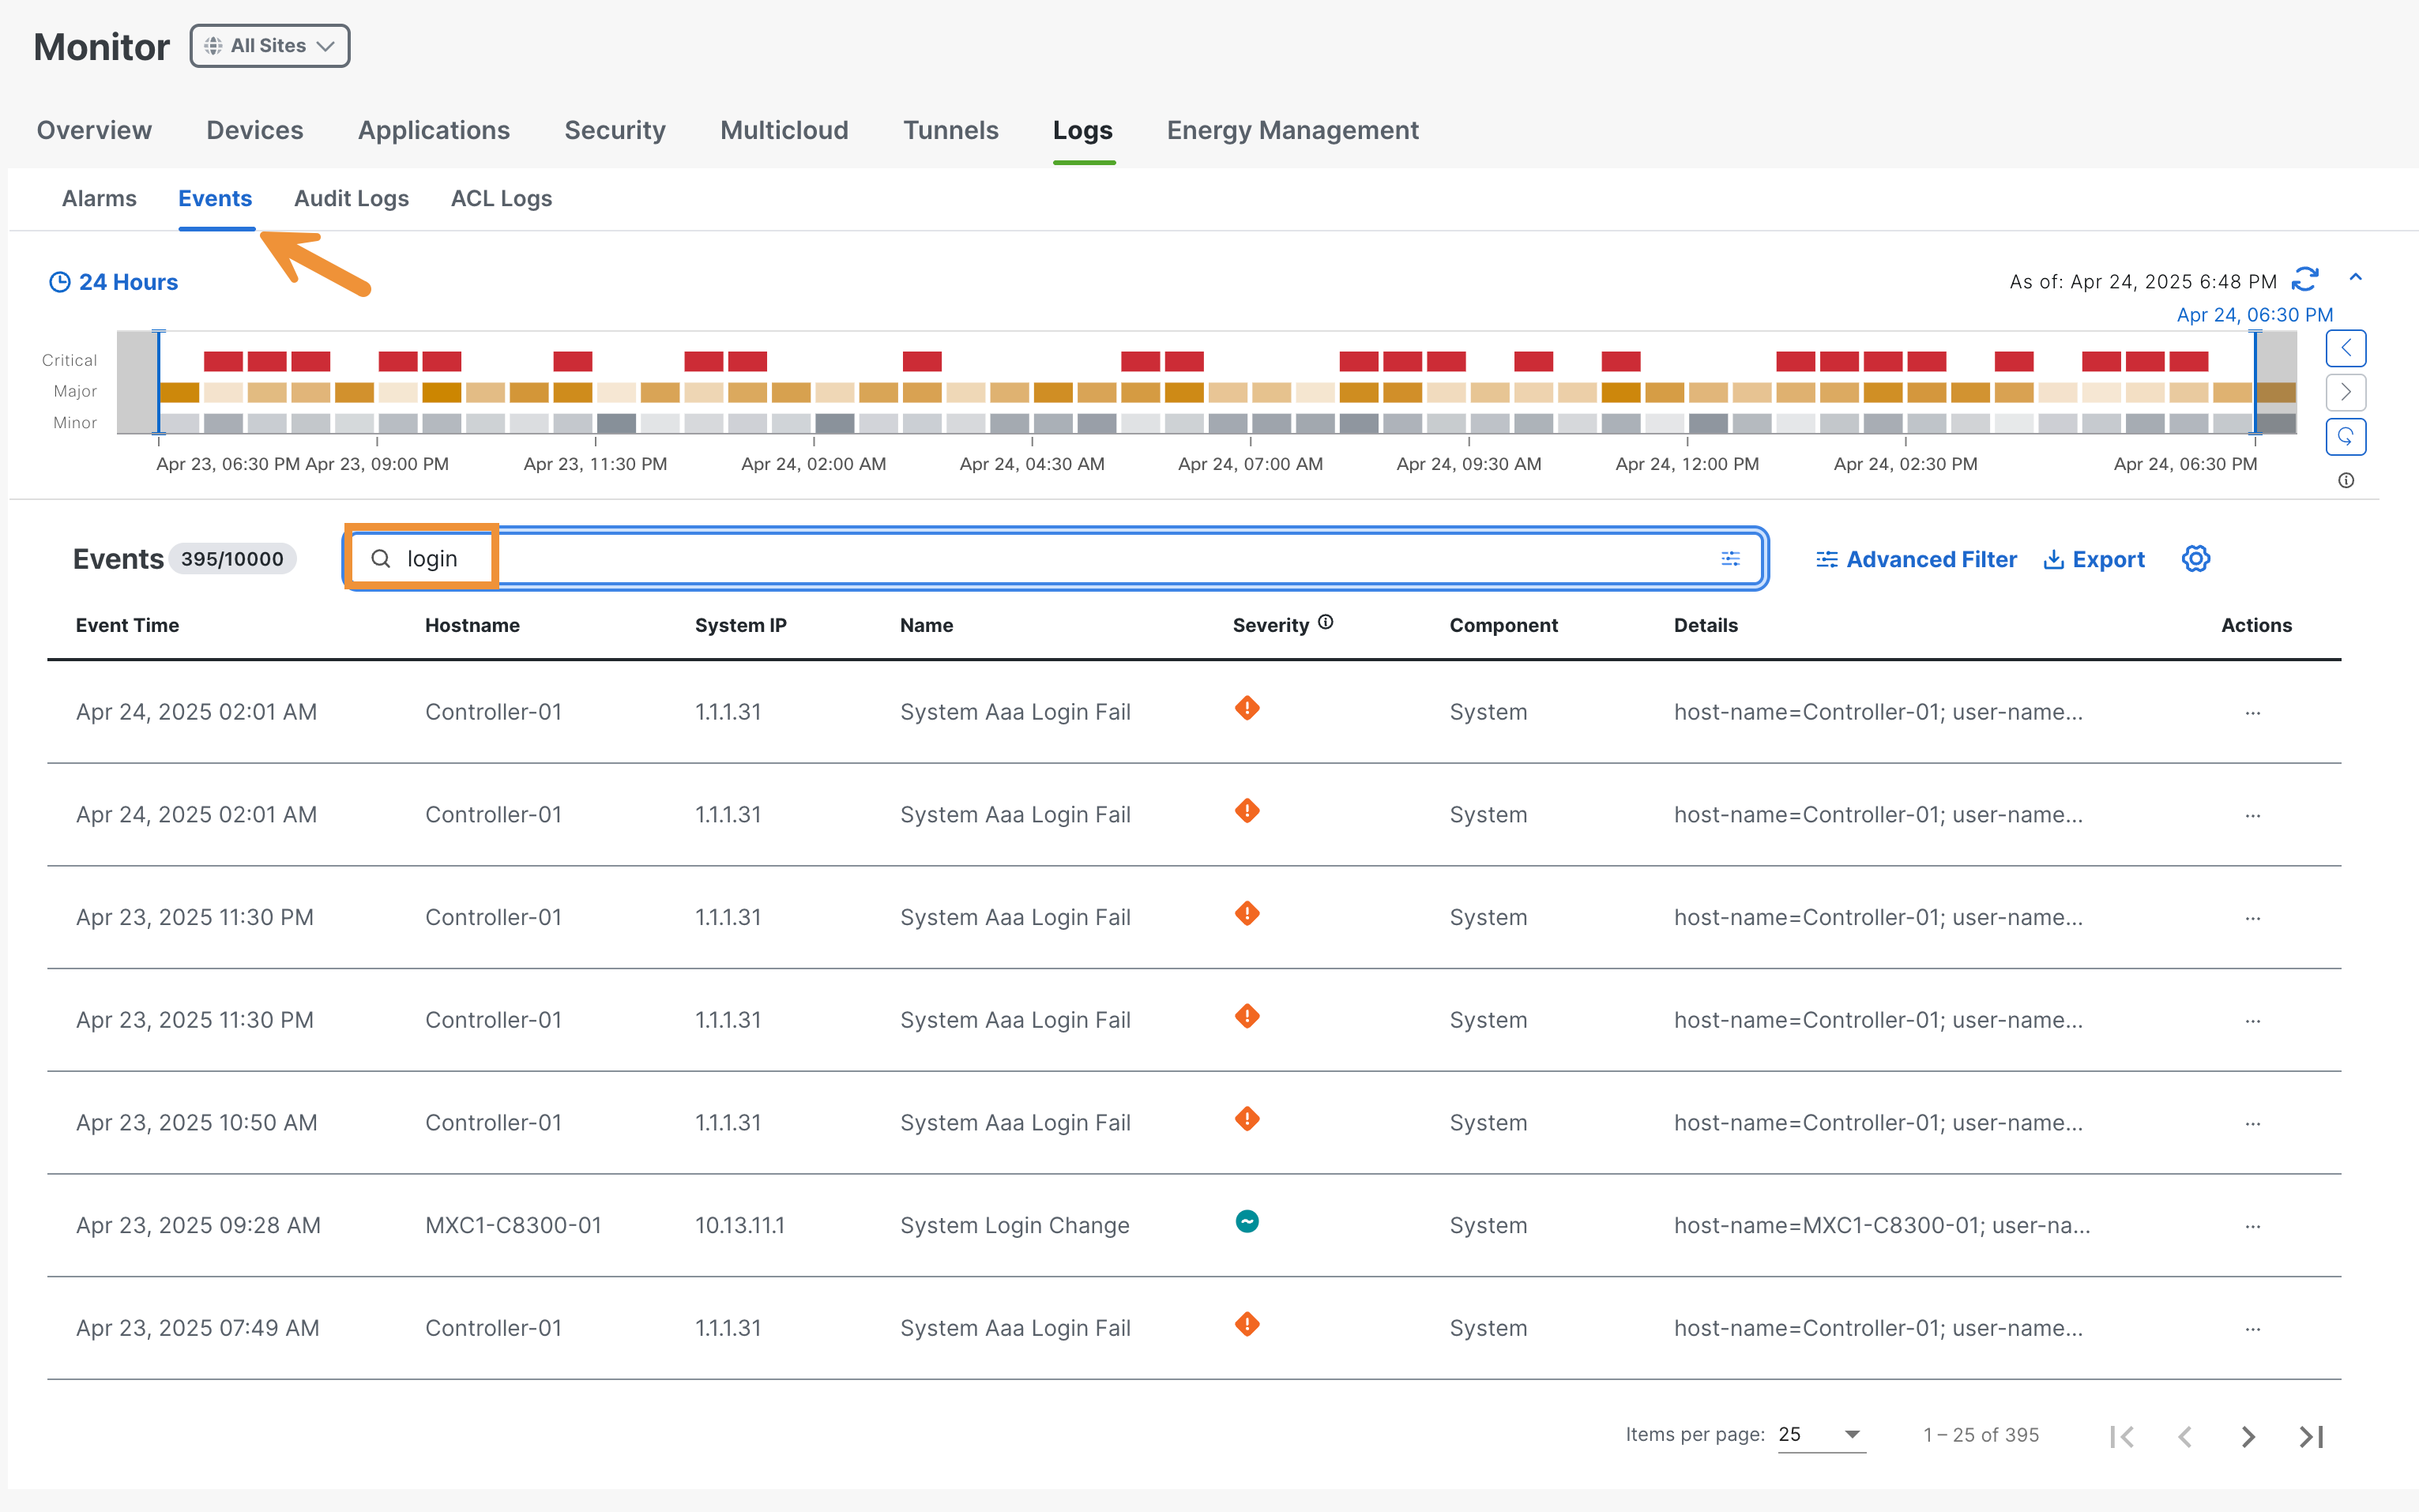
Click on the Events tab and take a moment to review some important events. Type login in the search bar in order to filter only the login-related events at the bottom.
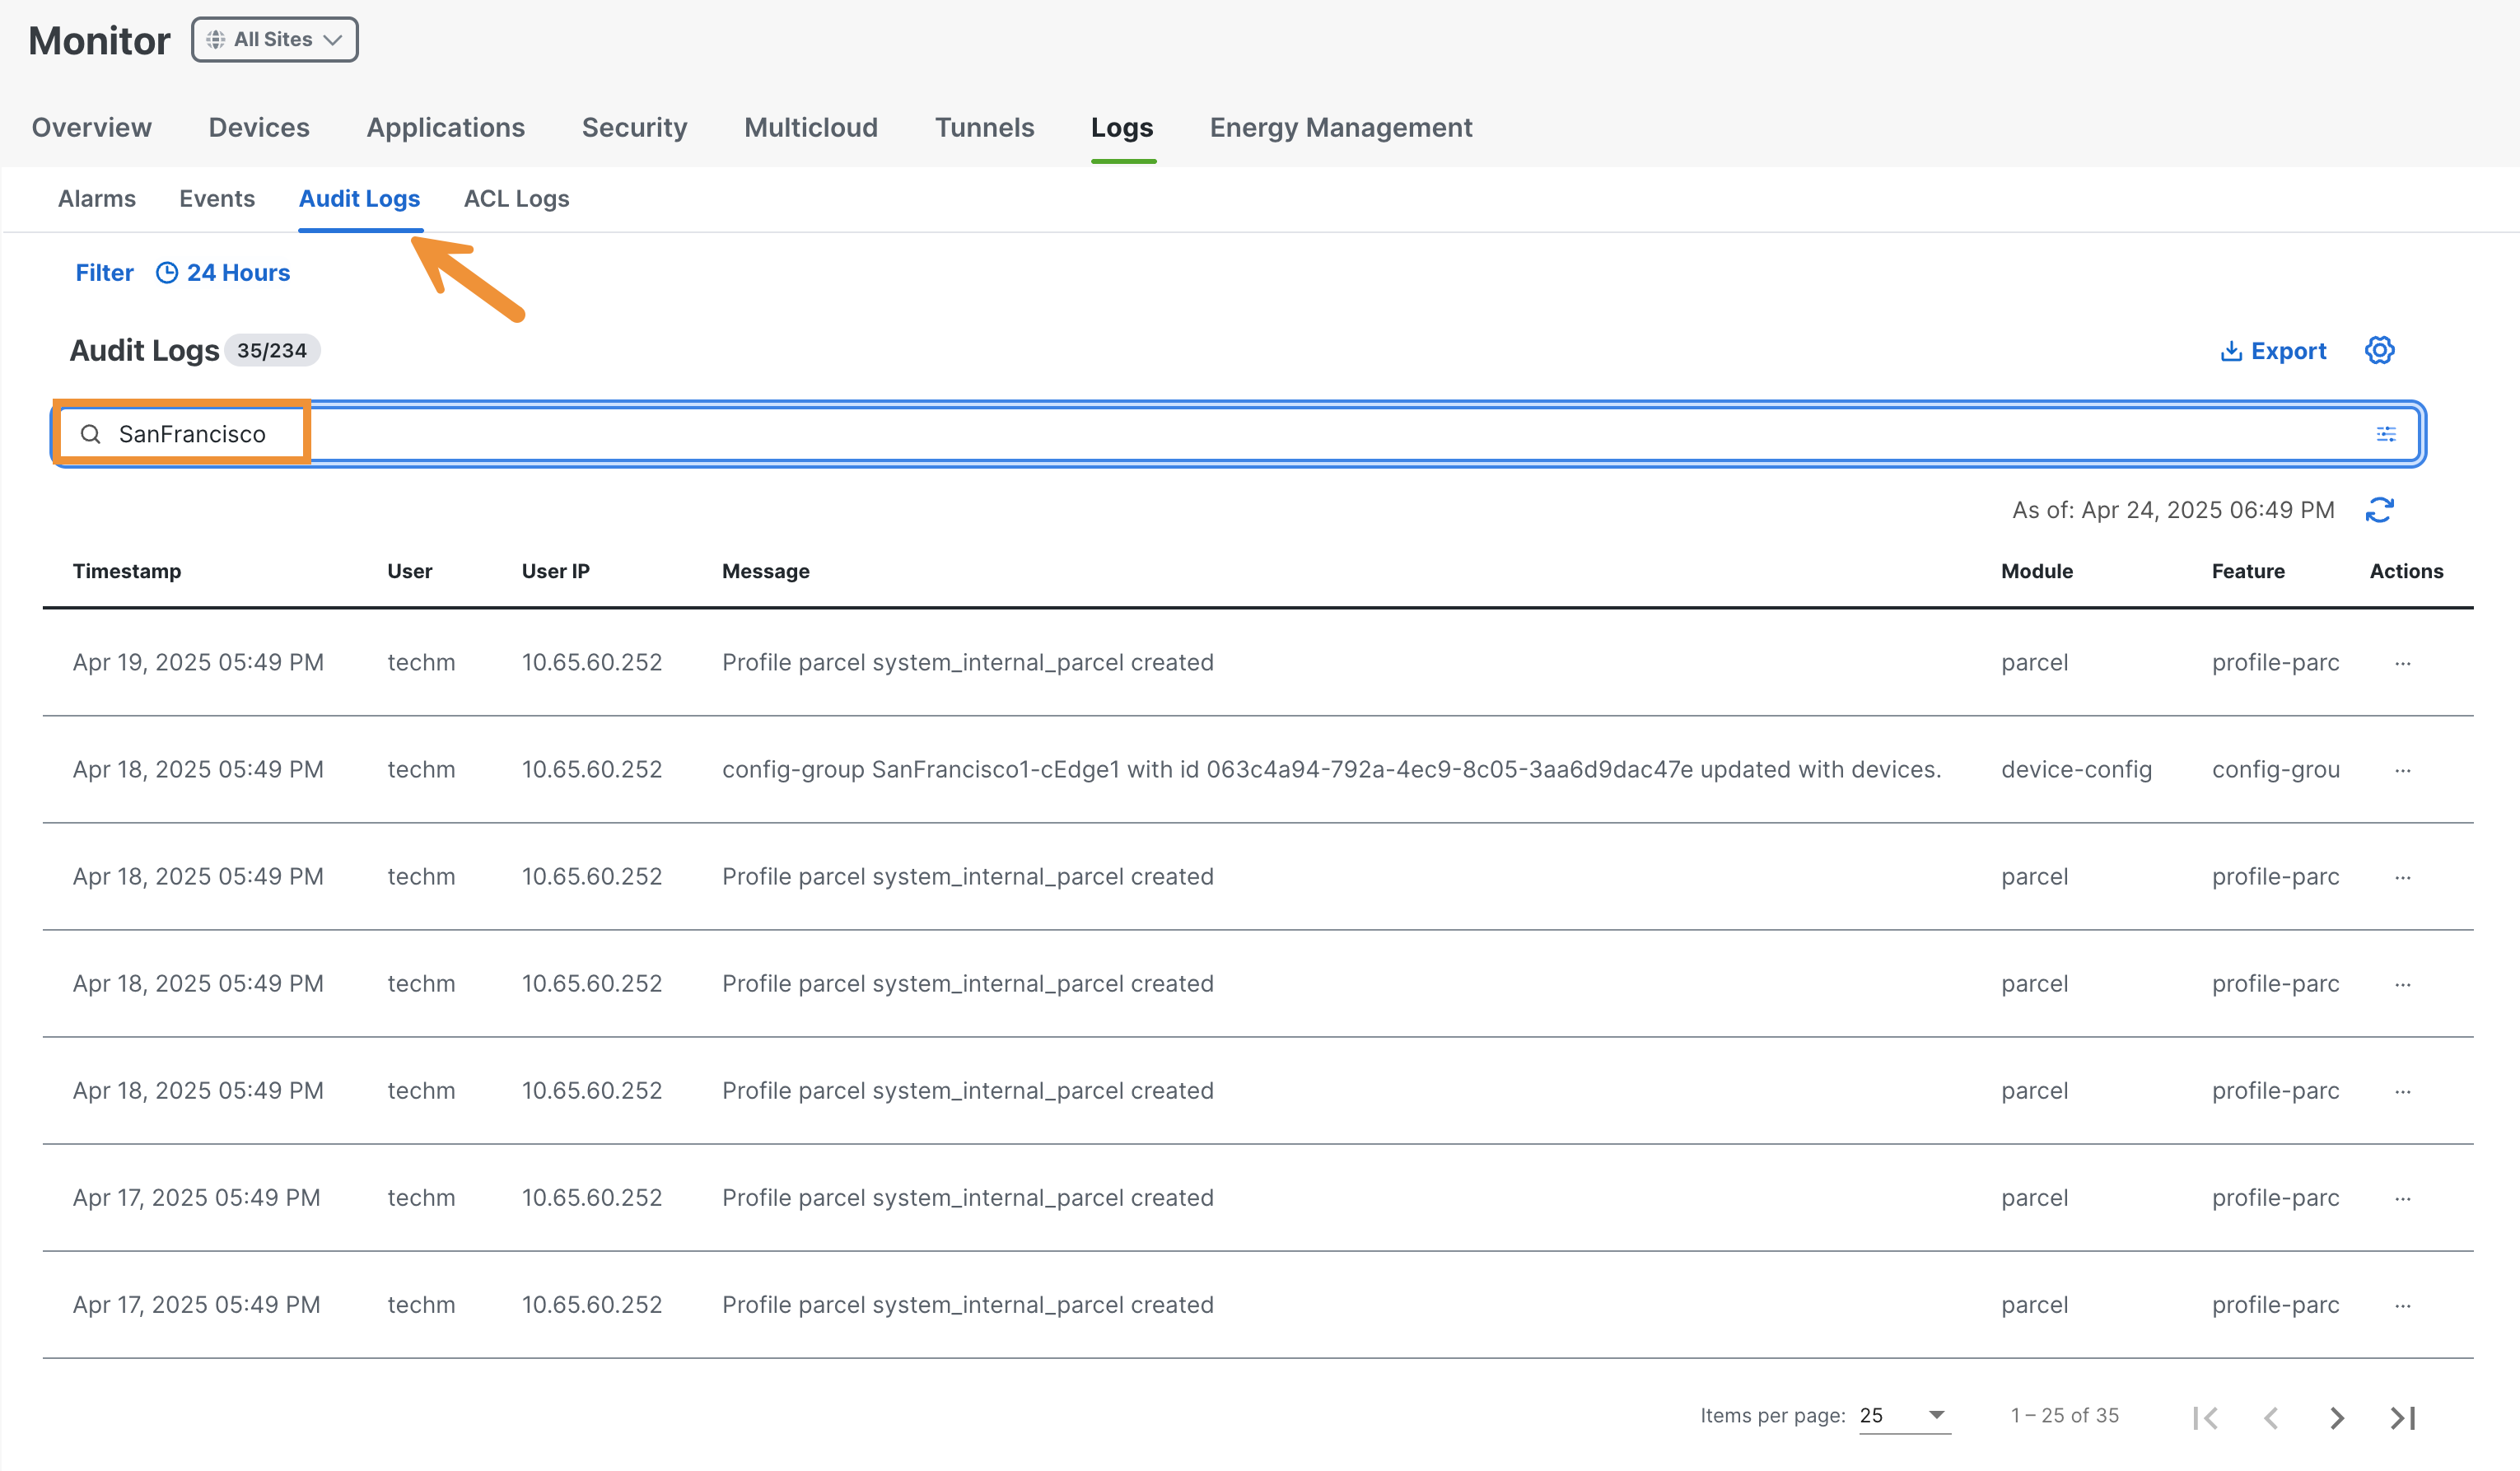
Click on the Audit Logs tab and take a moment to review some important audit logs. Type SanFrancisco in the search bar in order to filter only the site-related logs at the bottom.
Review the SD-WAN Security Policy Elements
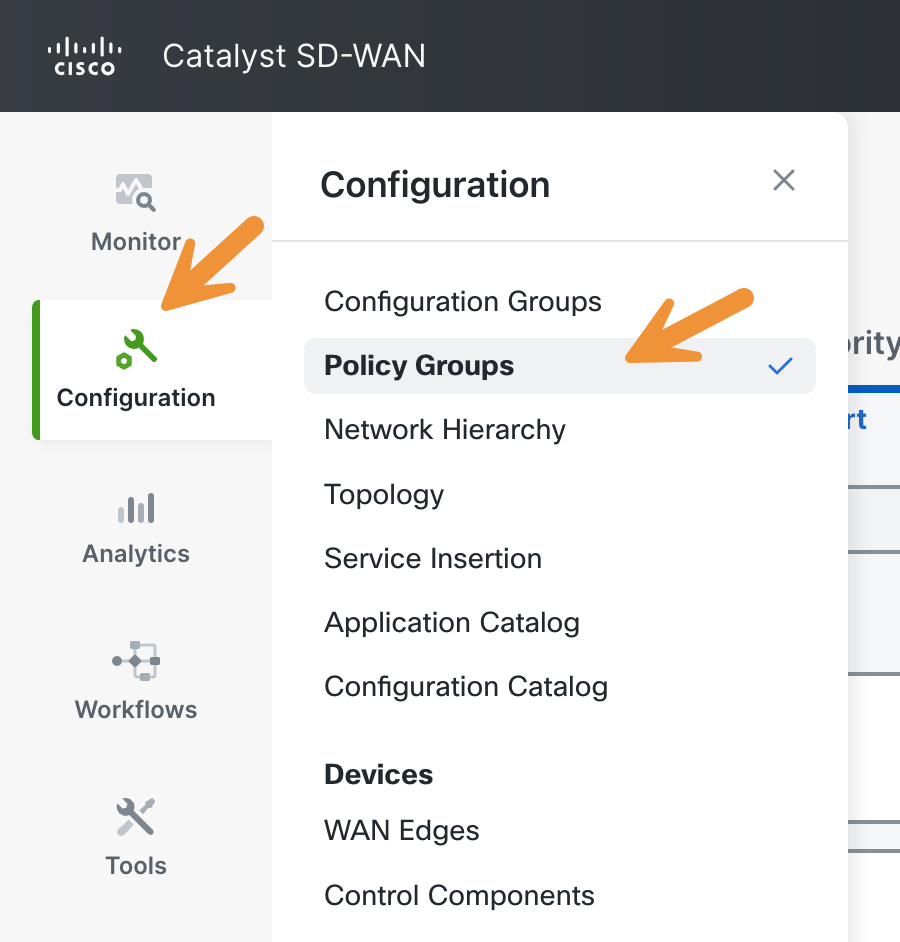
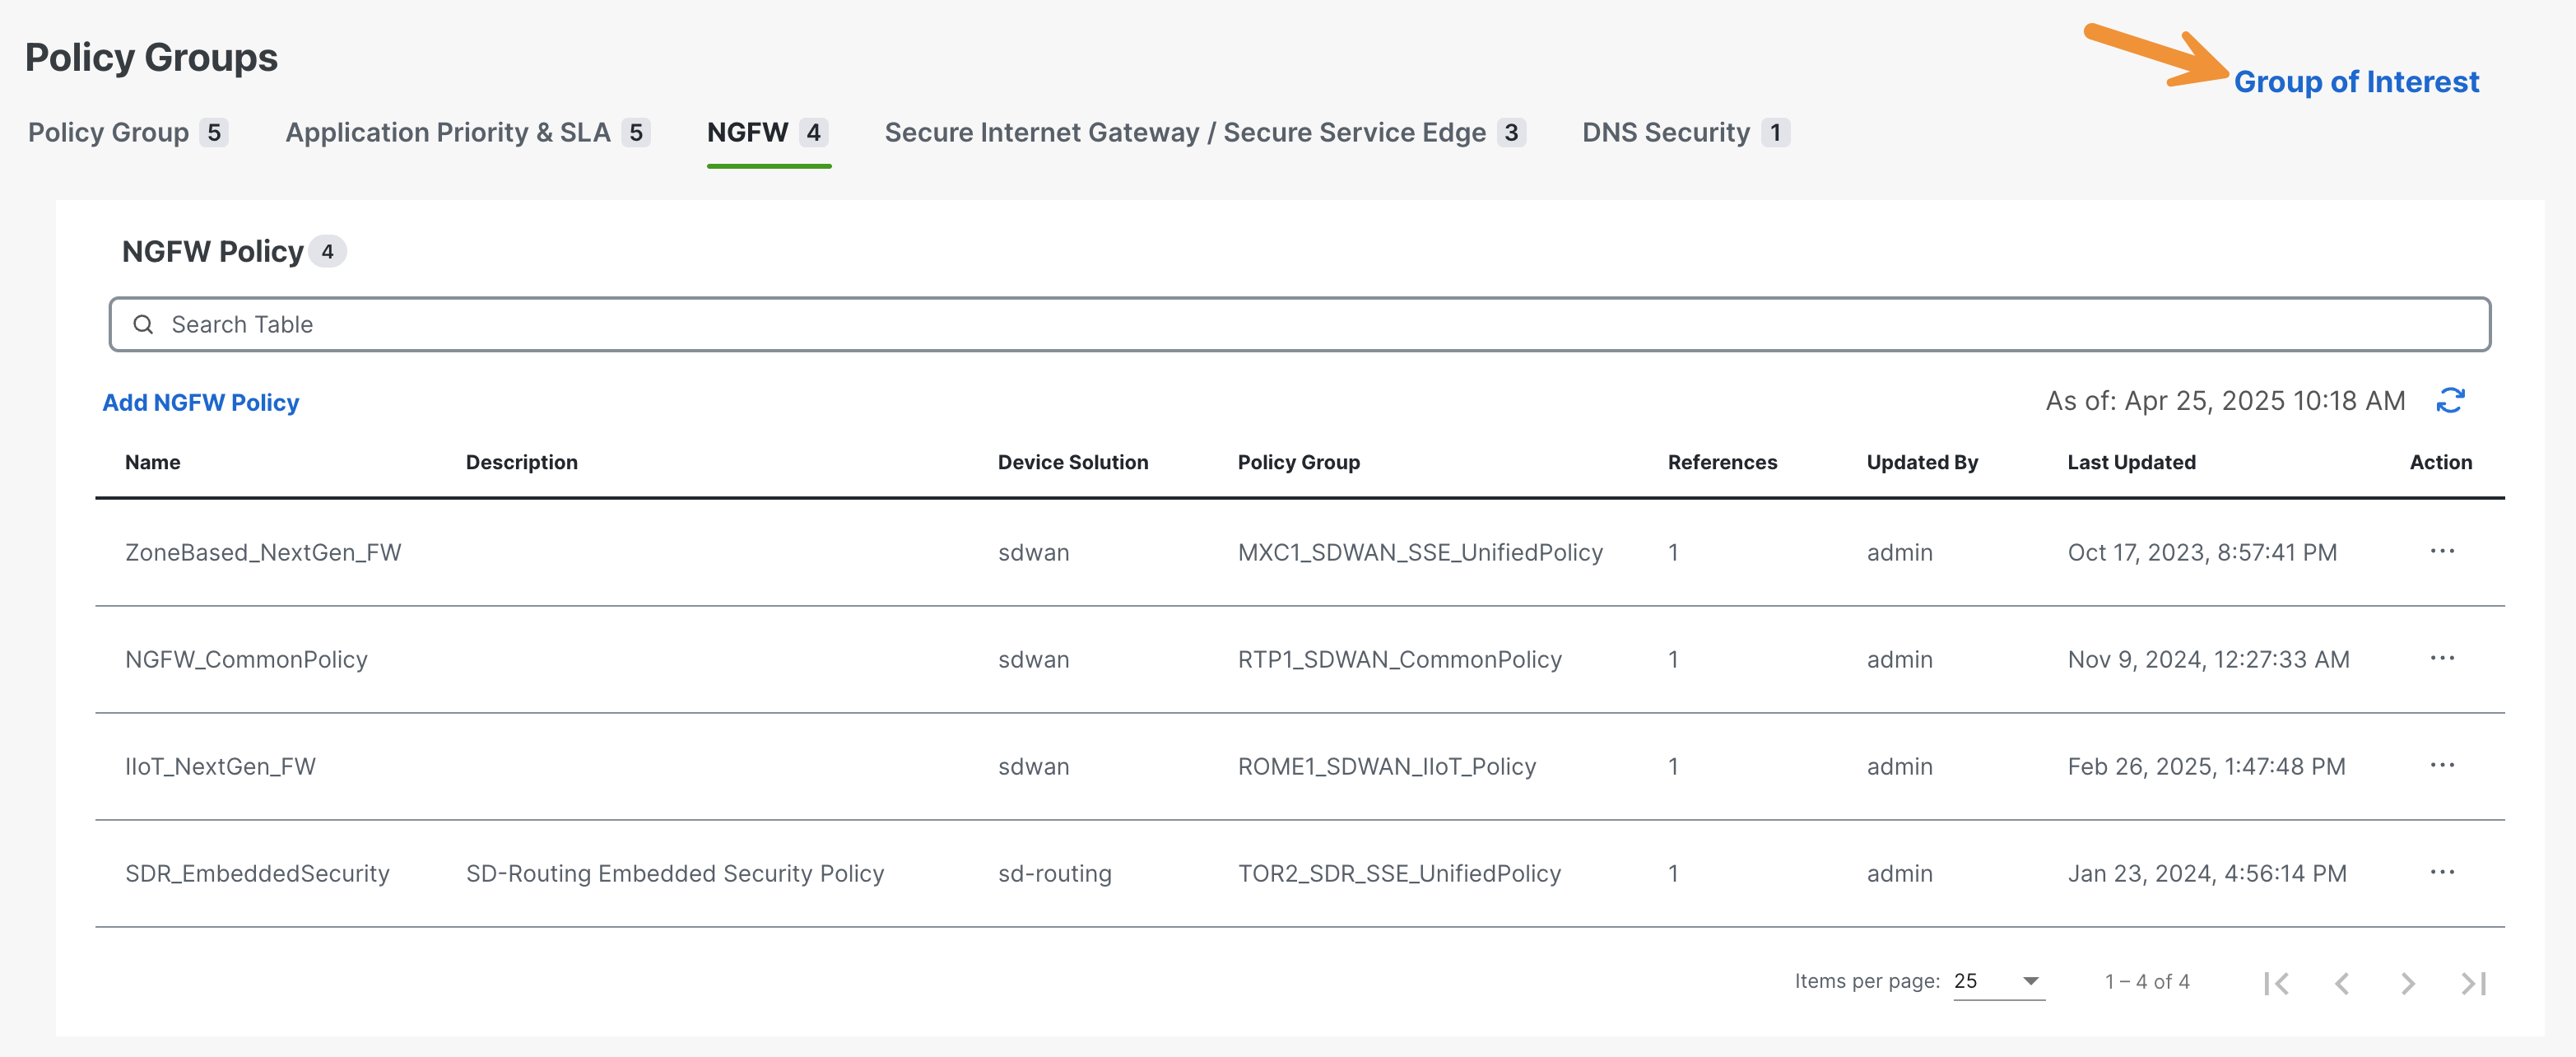
To start, navigate to Configuration > Policy Groups in the SD-WAN Manager.
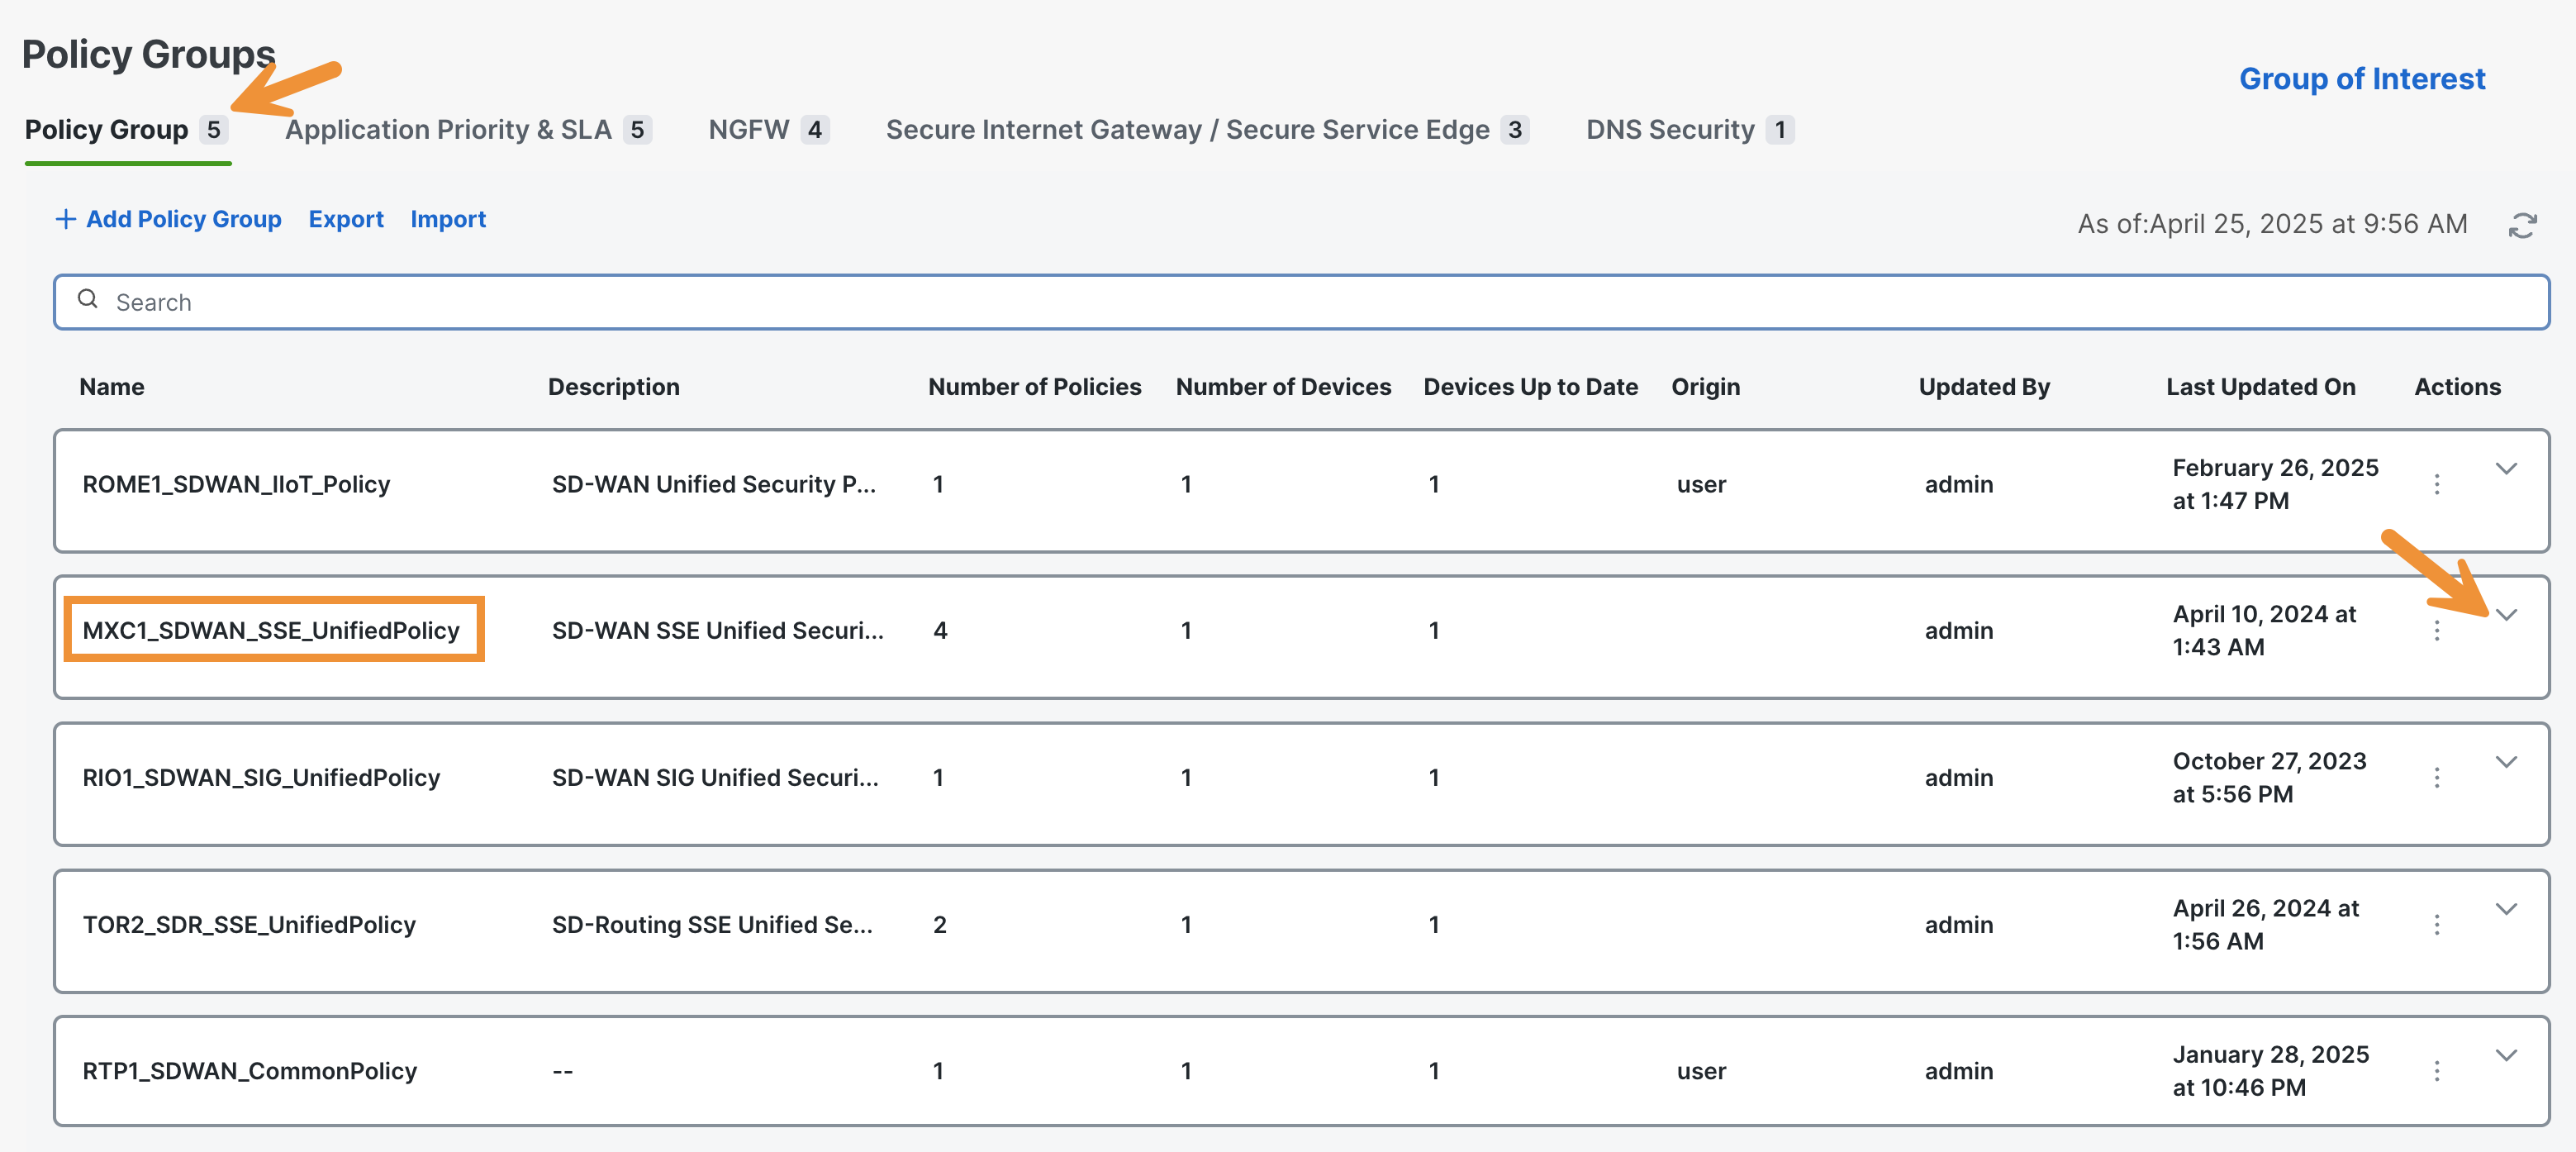
Click on the MXC1_SDWAN_SSE_UnifiedPolicy policy on the Policy Group page to access more detailed information.
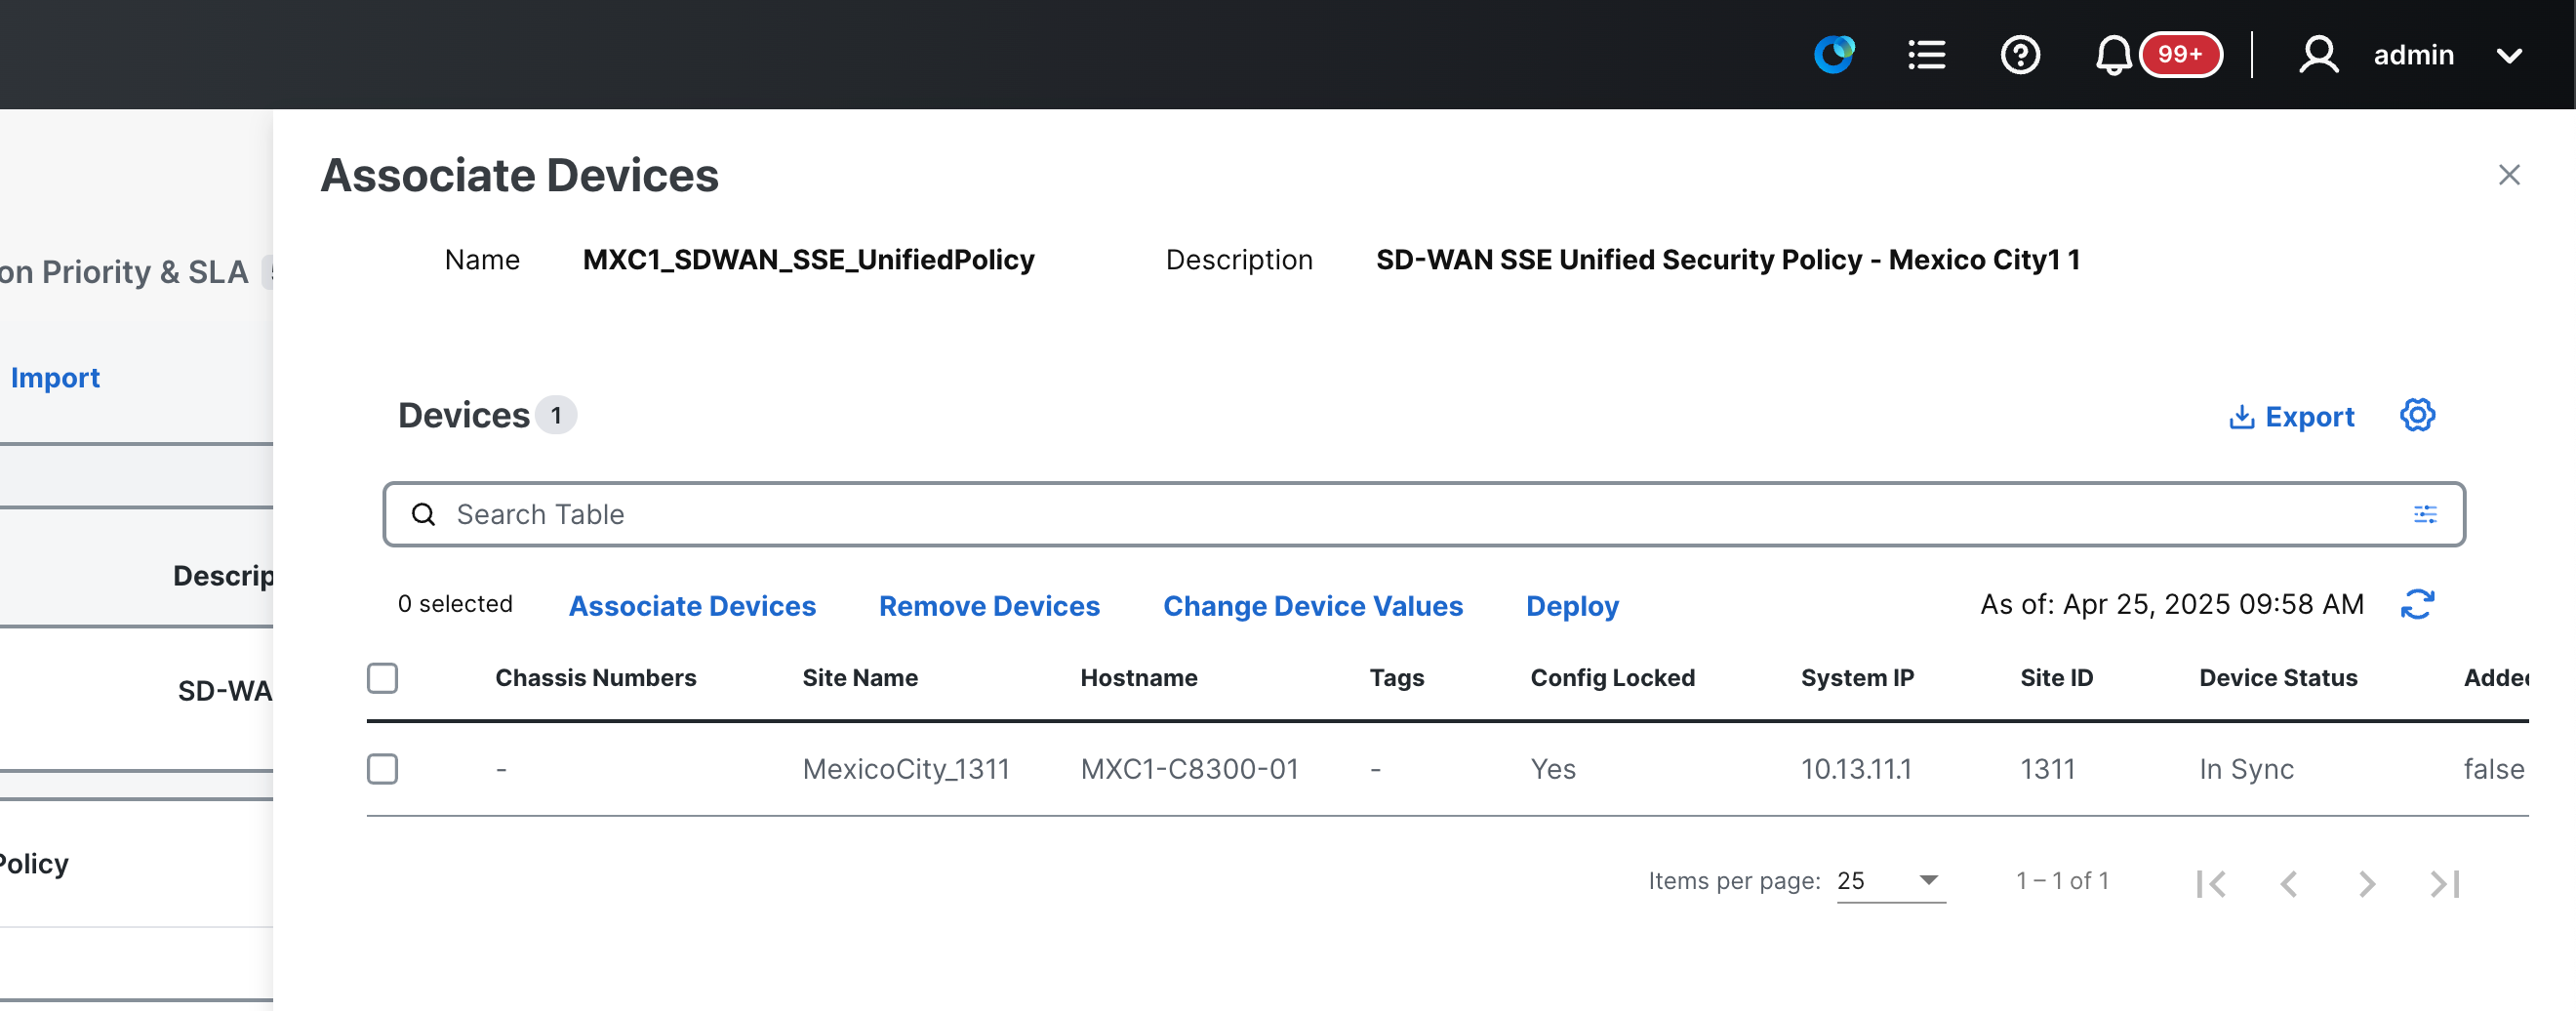
Click on the small blue pencil located under Deployment to view the devices currently attached to this Policy Group. In the slide-out panel that appears, you will find the listing for the MXC-C8300-01 device (Mexico City).
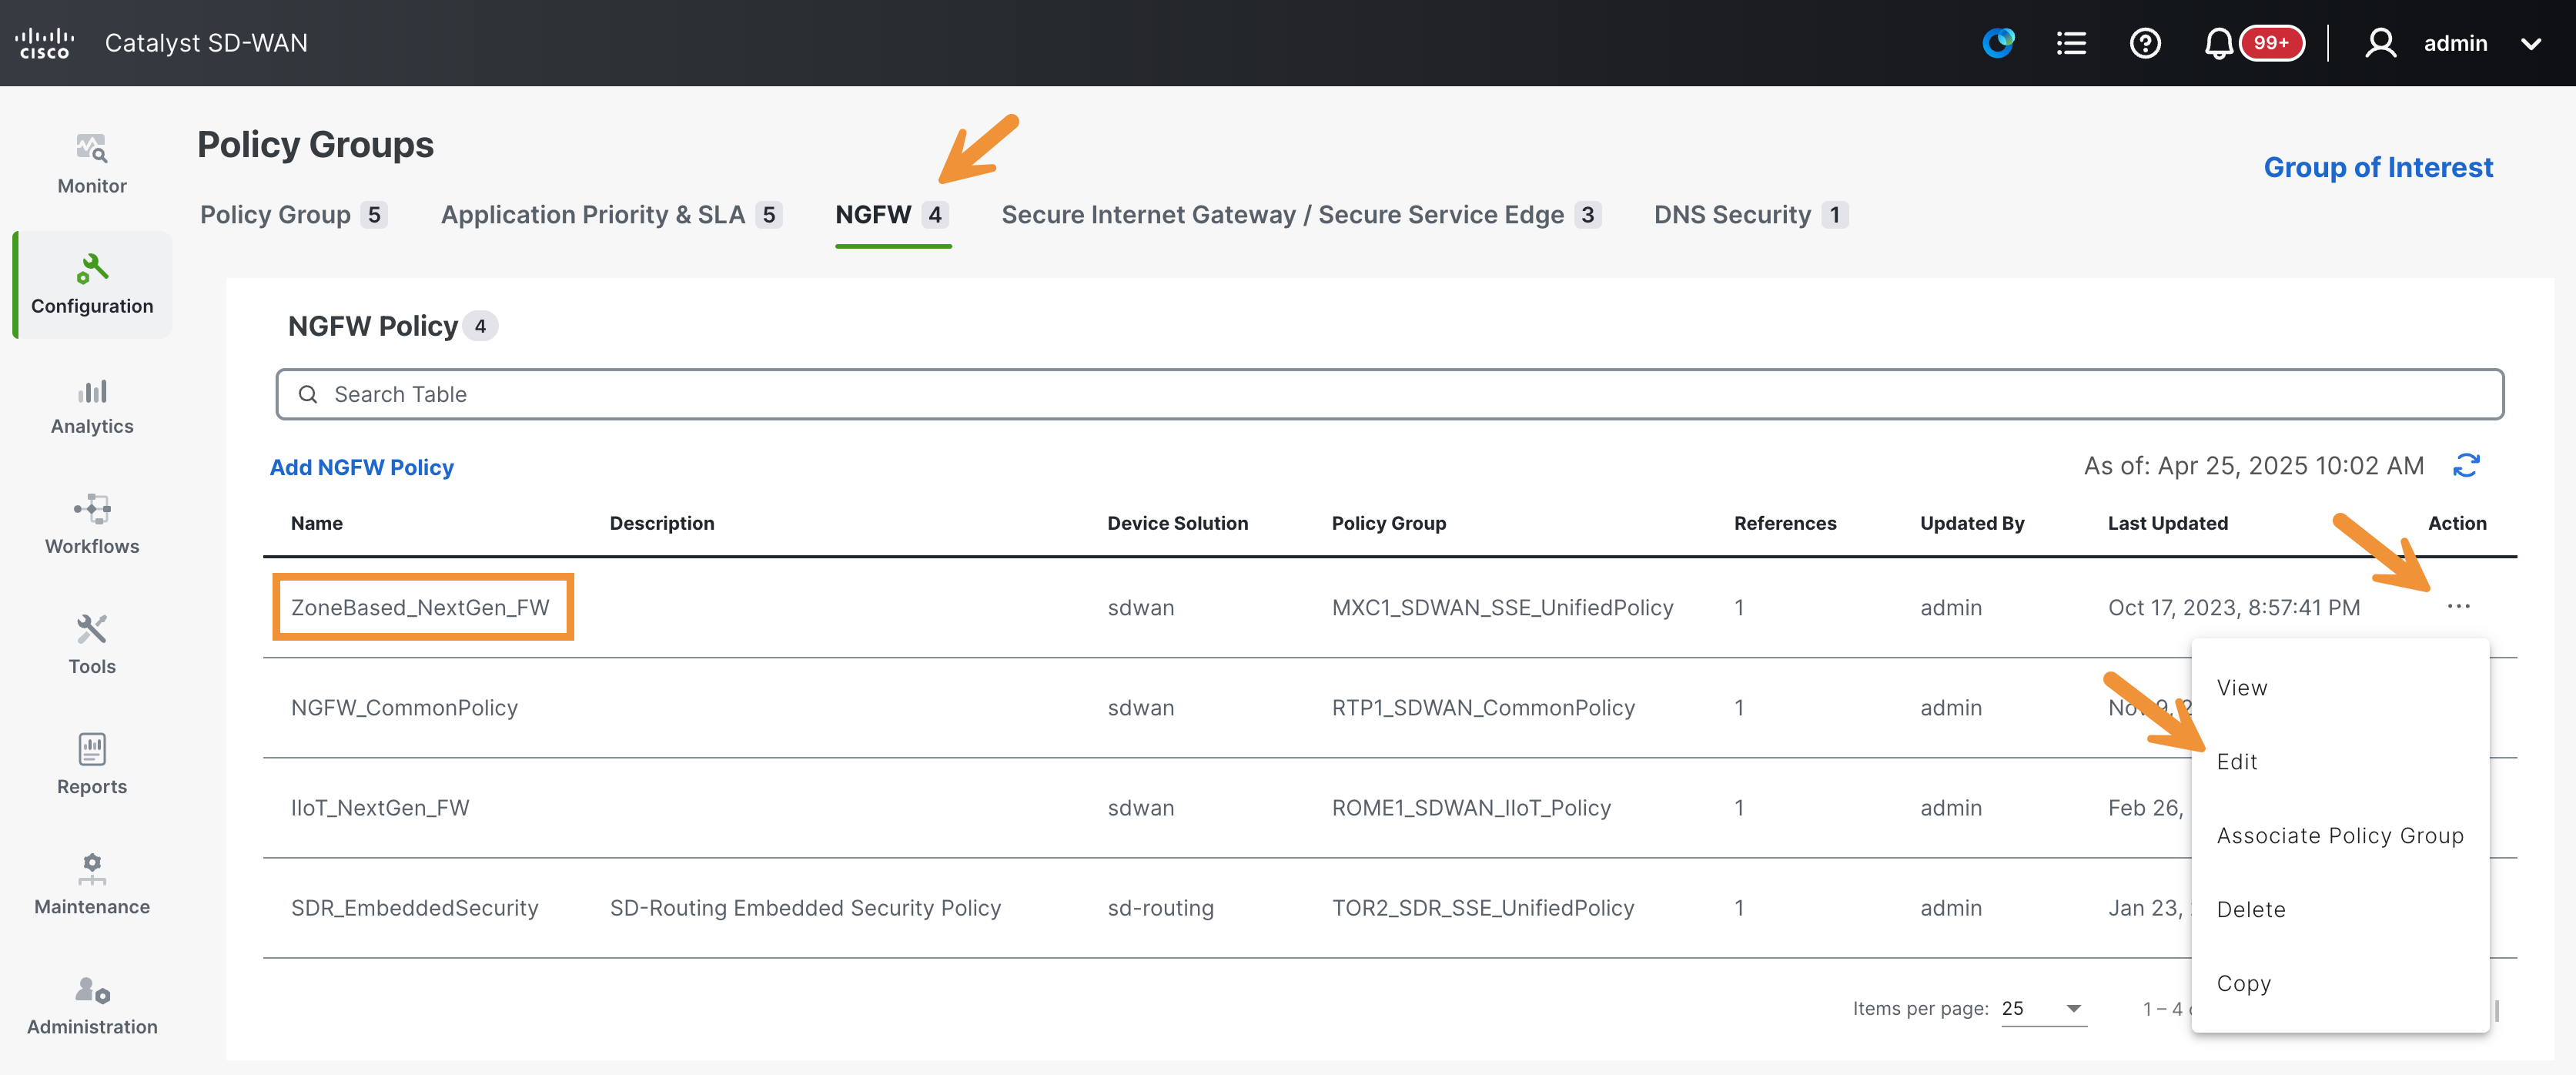
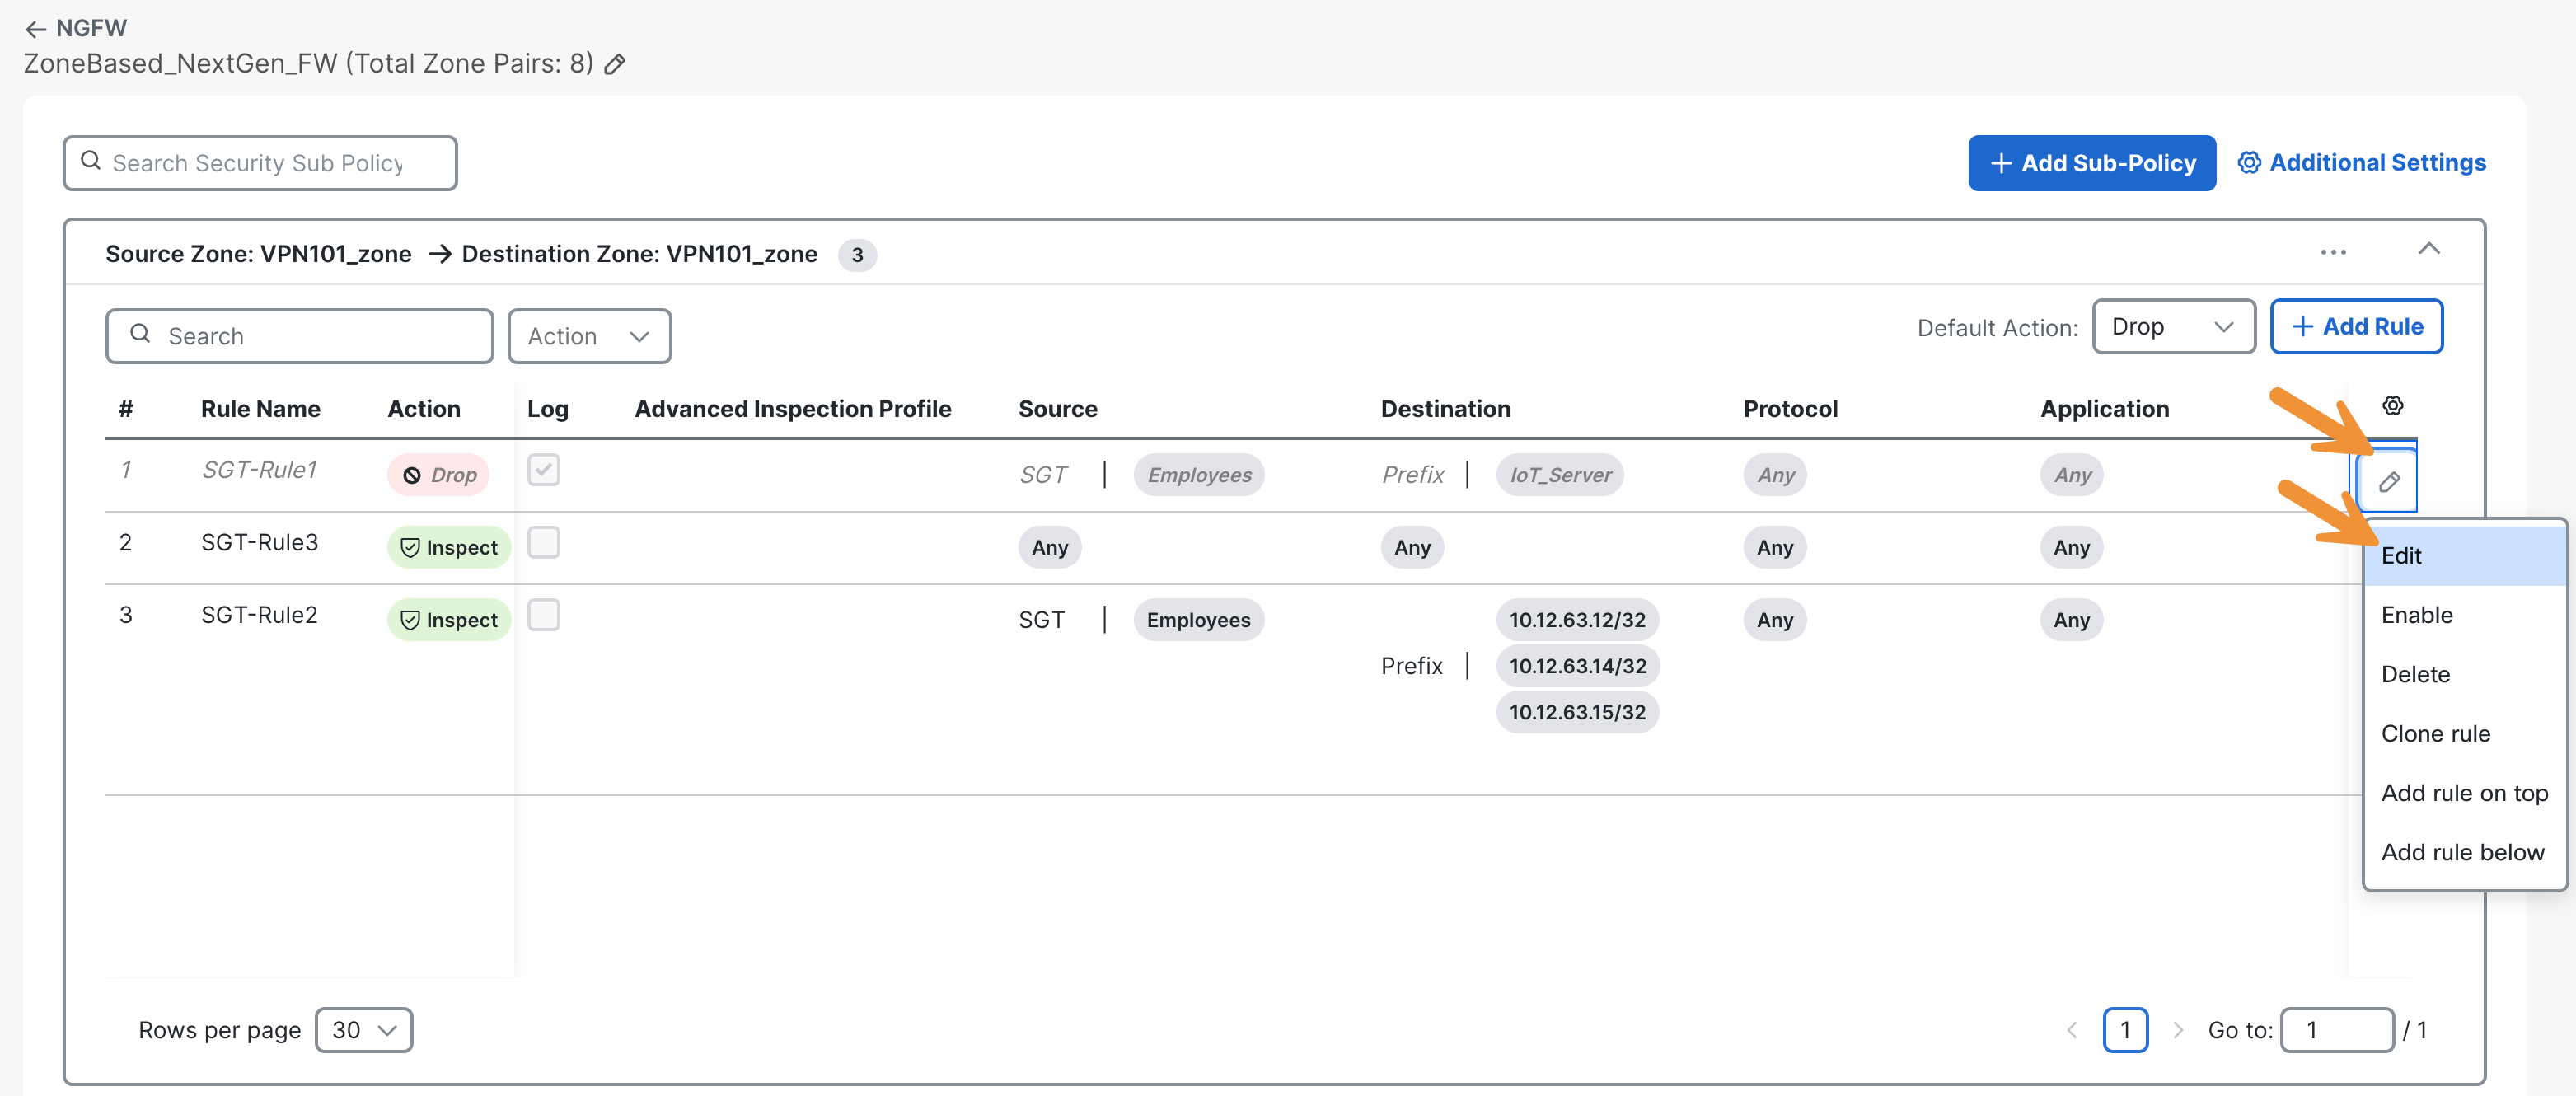
Close the slide-out panel, then click on the NGFW tab to see the policy that is a component of the Policy Group applied to the Catalyst 8300 in MXC (MXC-C8300-01). Click on the three dots to the right of the ZoneBased_NextGen_FW policy and select Edit from the menu.
On the resulting page, you will find the test rules that have been created for VPN101 as the source zone to highlight the product capabilities.
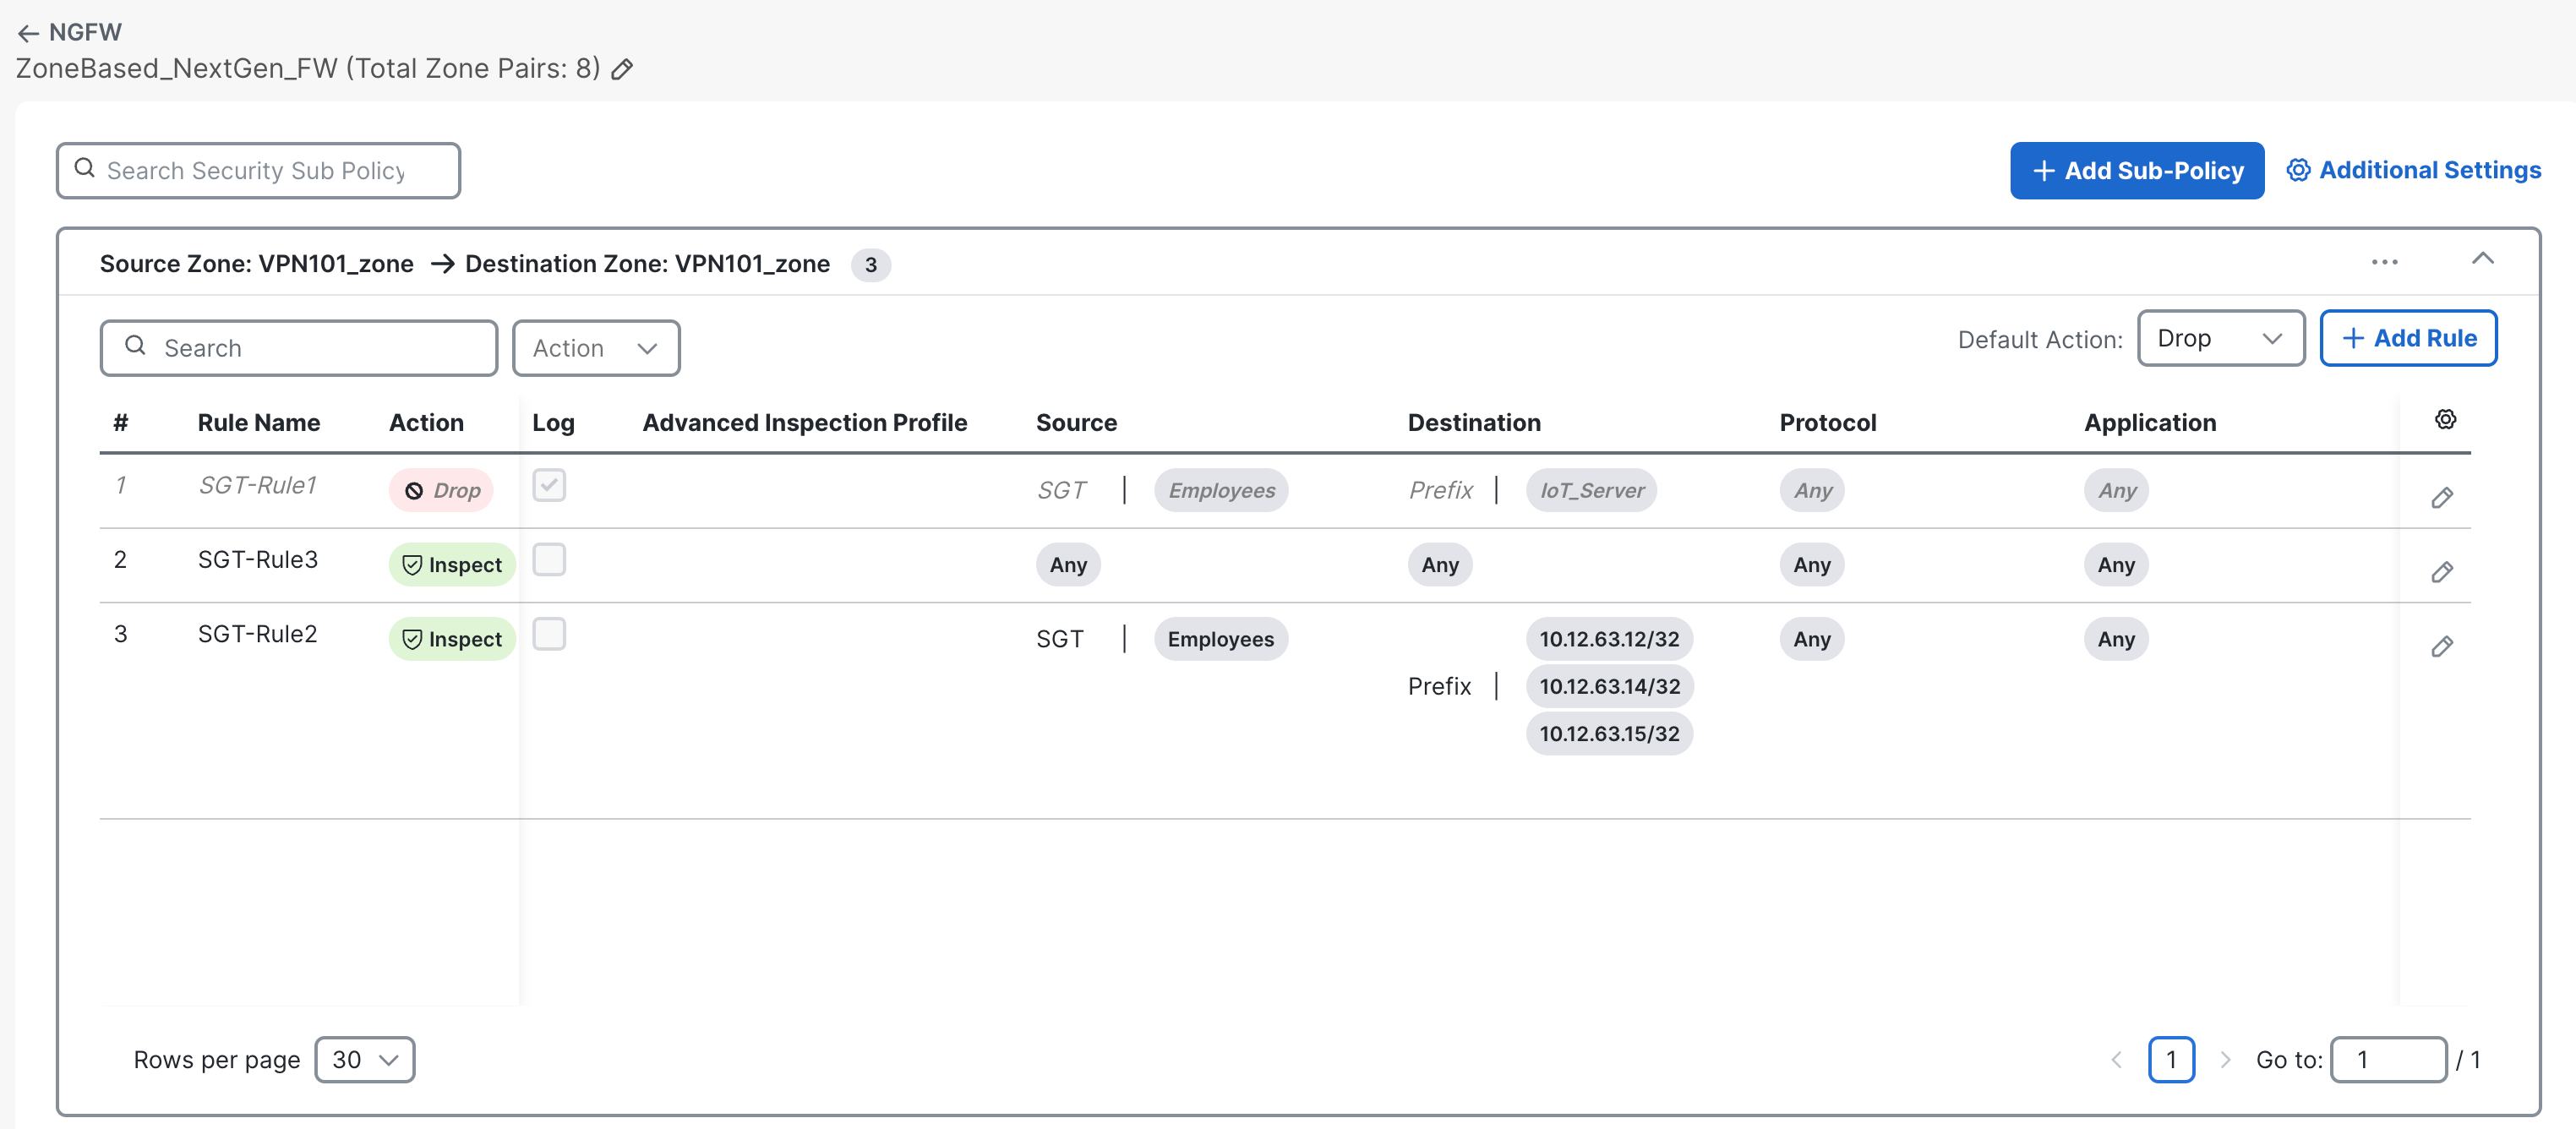
Click on the pencil icon, then Edit for each rule to check their details. Click Cancel after reviewing them.
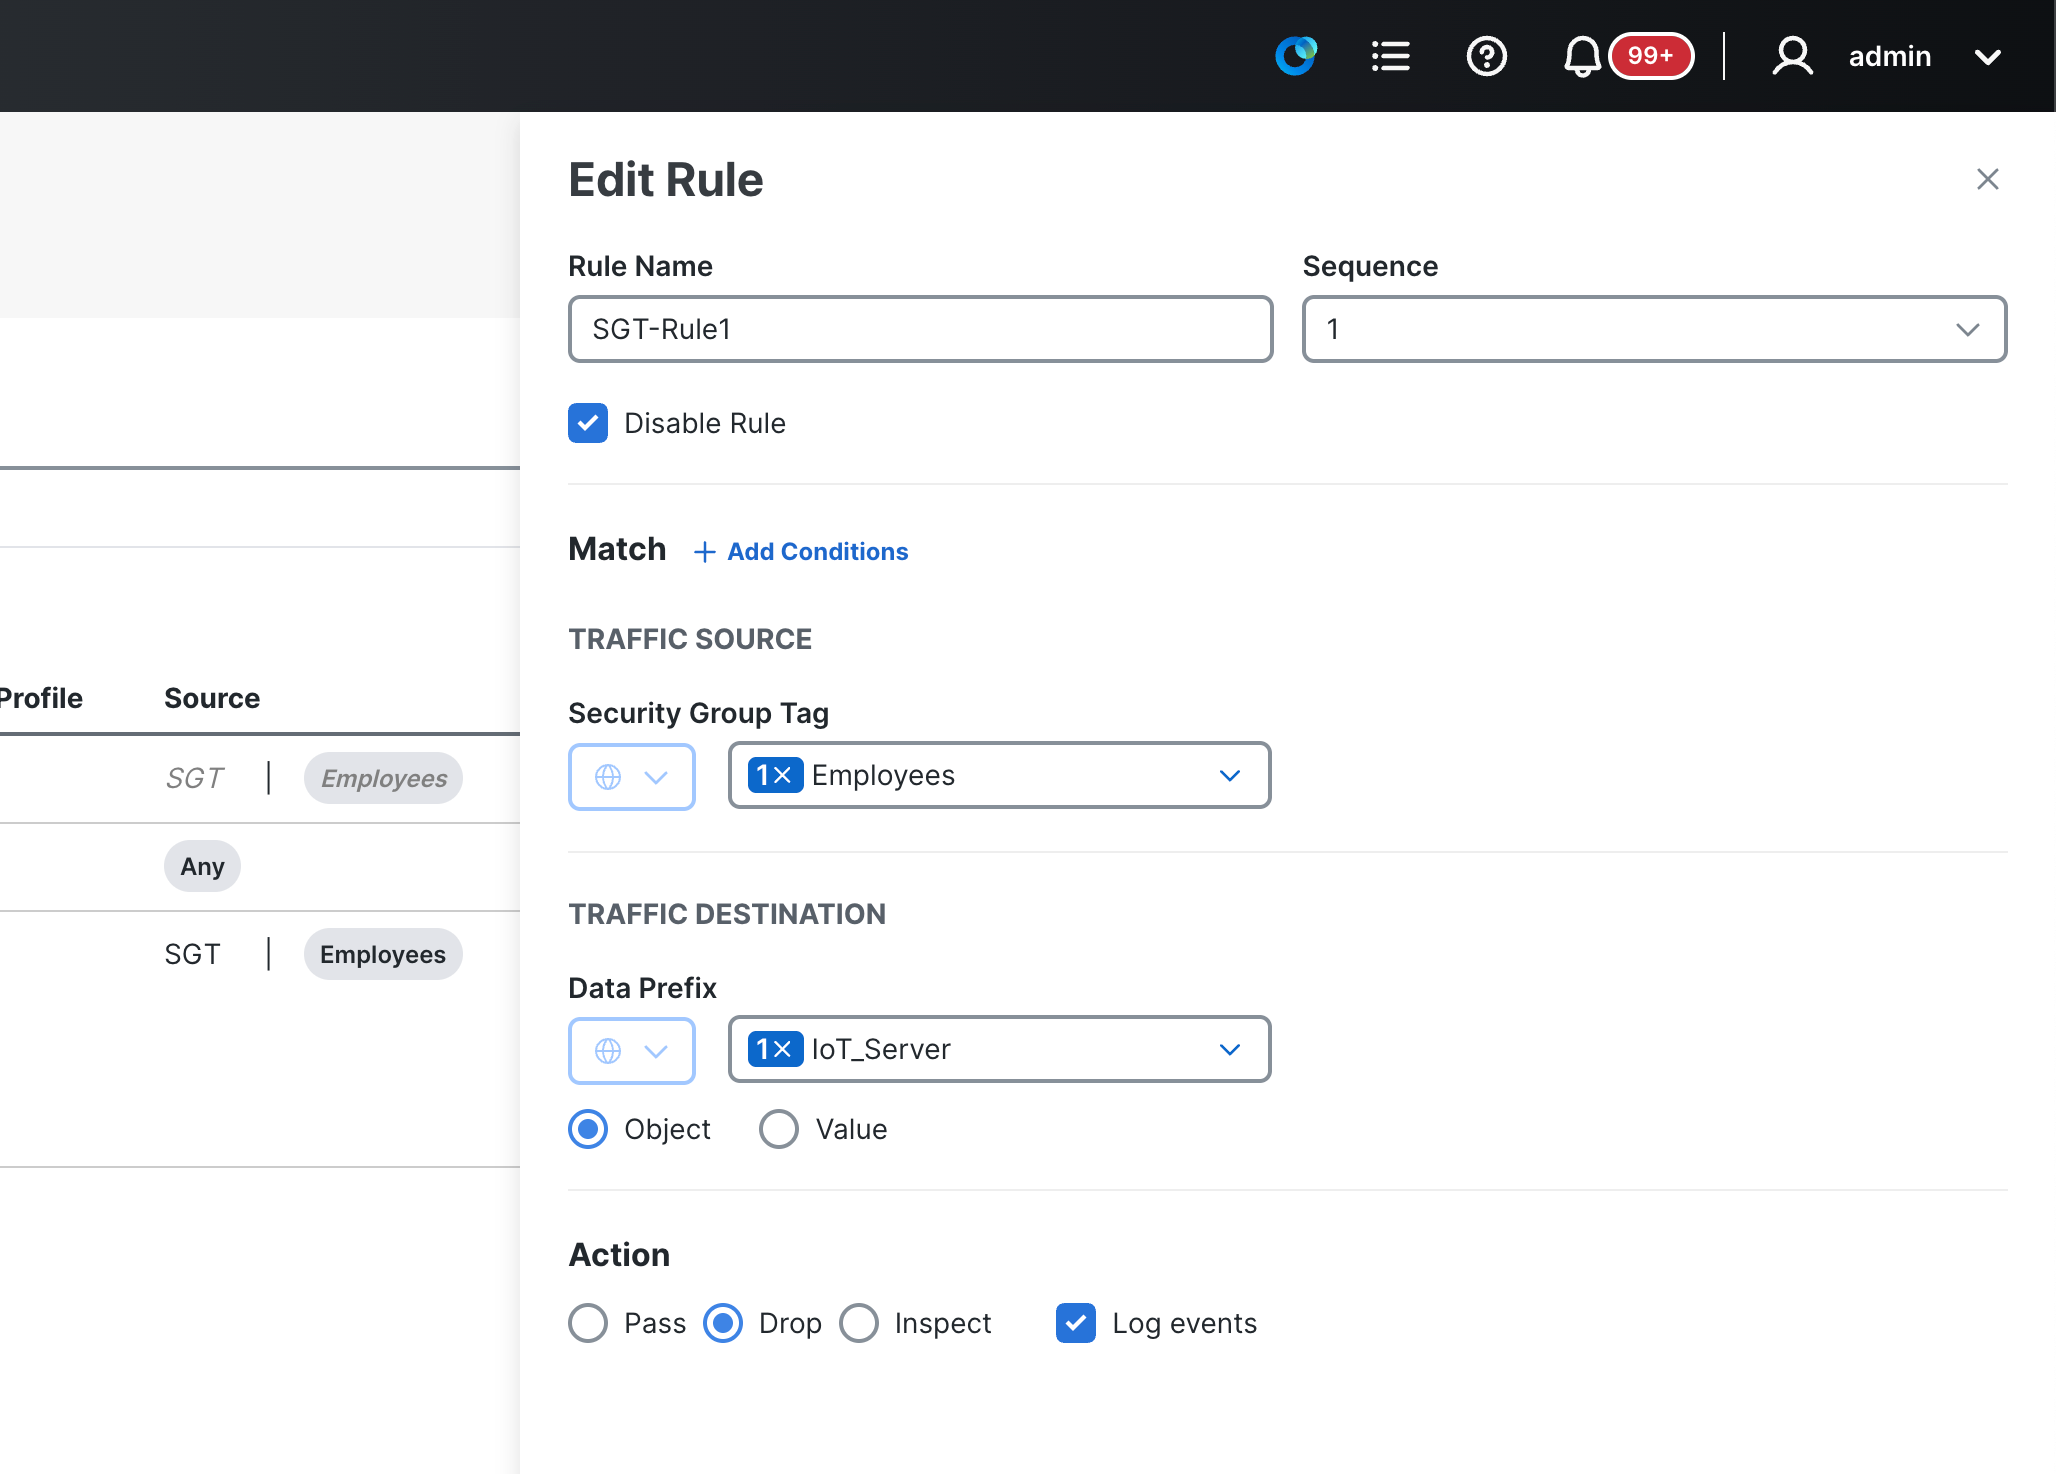
- The first rule (SGT-Rule1) denies connectivity from the Employees SGT to the IoT Servers Data Prefix. Click to expand for more details. Here, under match conditions, with the Integration of SD-WAN and ISE, administrators have the ability to write SGT-aware rules to be enforced on the WAN Edge router between VPNs, the outside, DIA traffic, or inter-VPN.
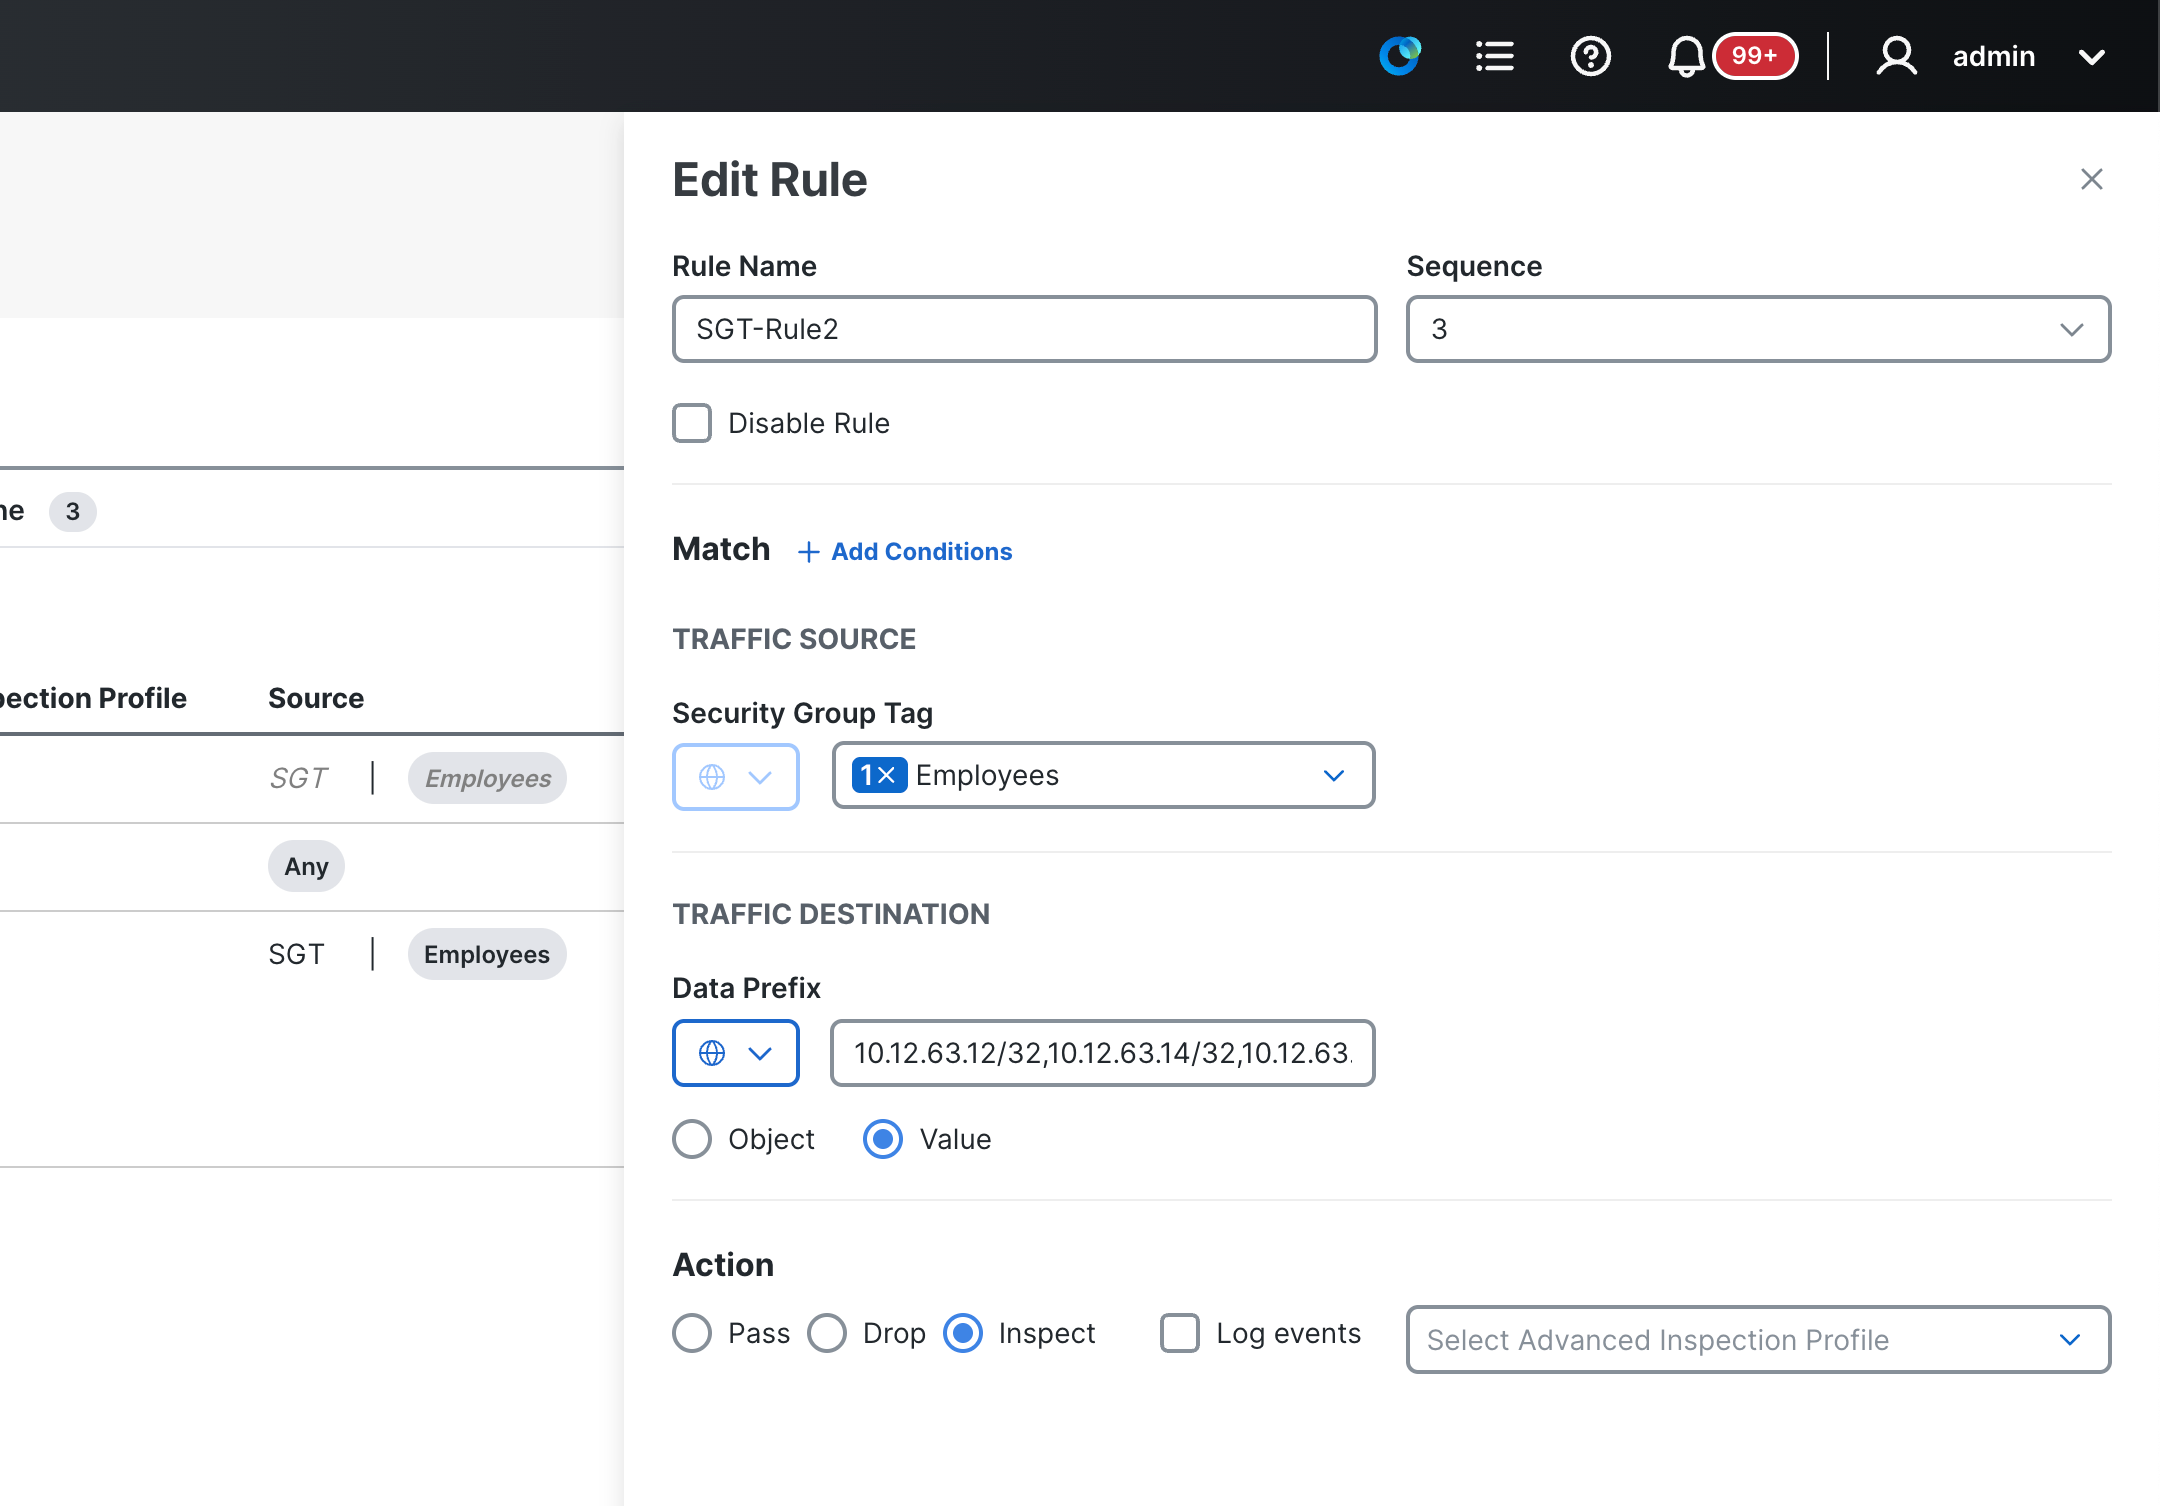
- The second rule (SGT-Rule2) inspects connectivity from the Employees SGT to certain hosts defined by a data prefix list. Click to expand for more details. It contains the Security Inspection Policy, which specifies content URL filtering, AMP, and IPS configuration for the UTD engine
Next, review the configuration that makes up the SGT tag and the Advanced Inspection Profile within this NG Firewall. Begin by returning to the Configuration > Policy Groups page.
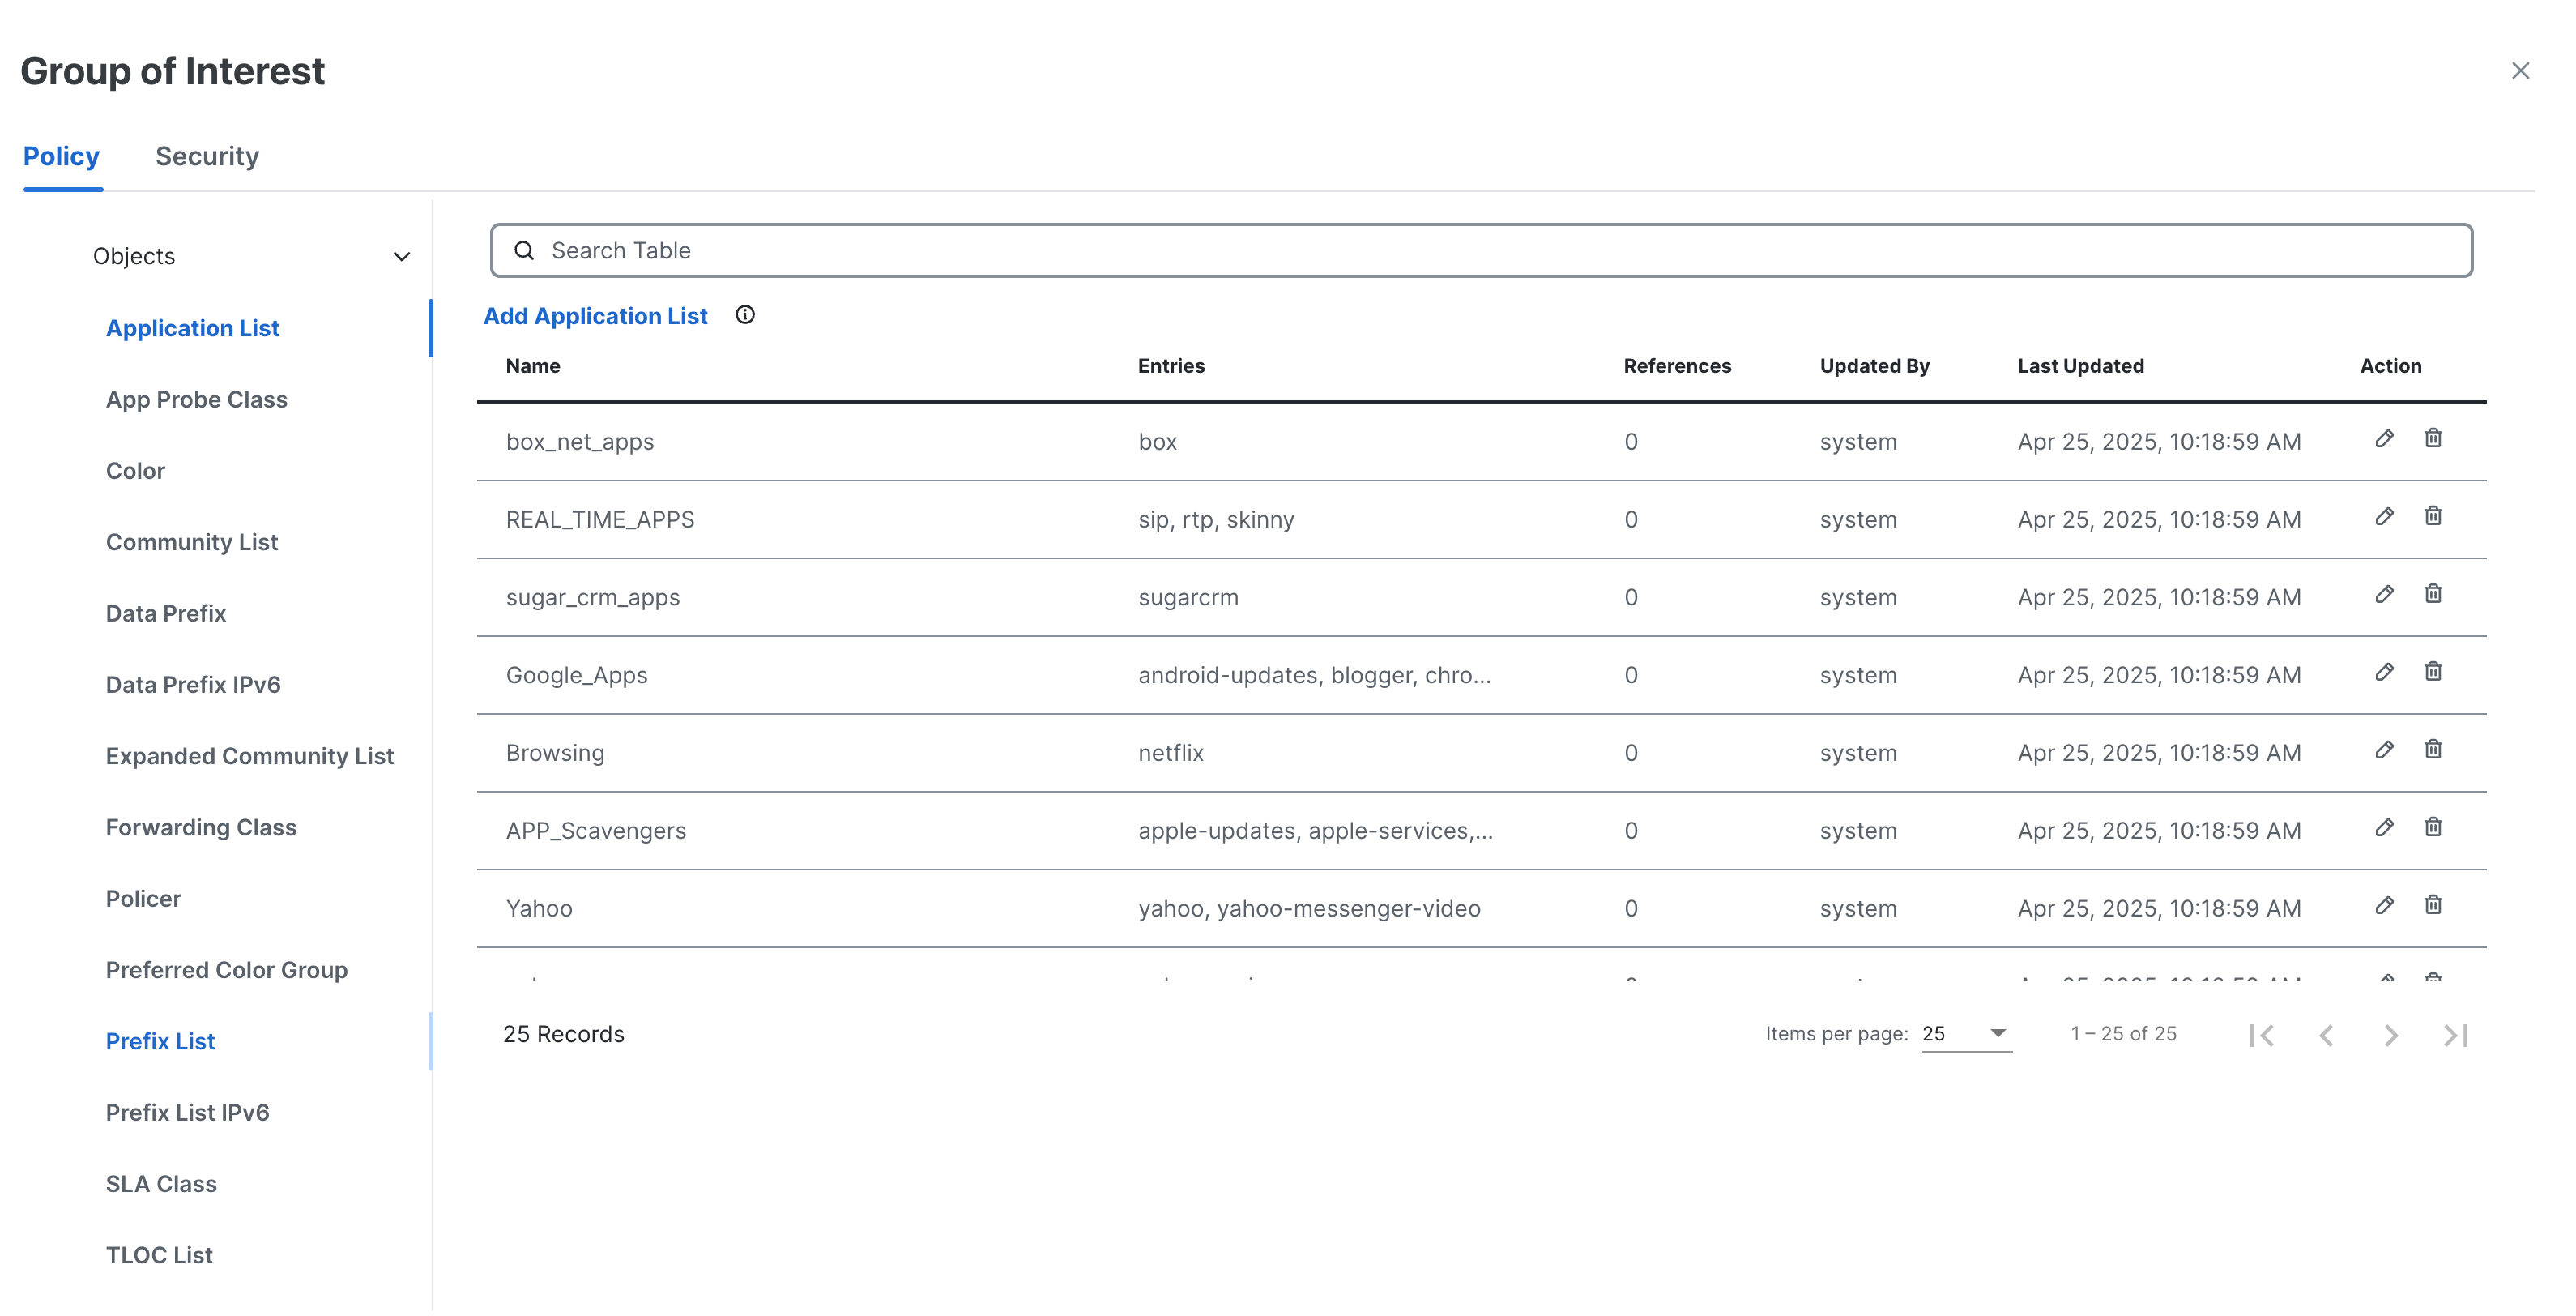
Please click on the Group of Interest link located at the top right of the page in blue. This will open a slide-out panel that contains all the information related to policies and rules.
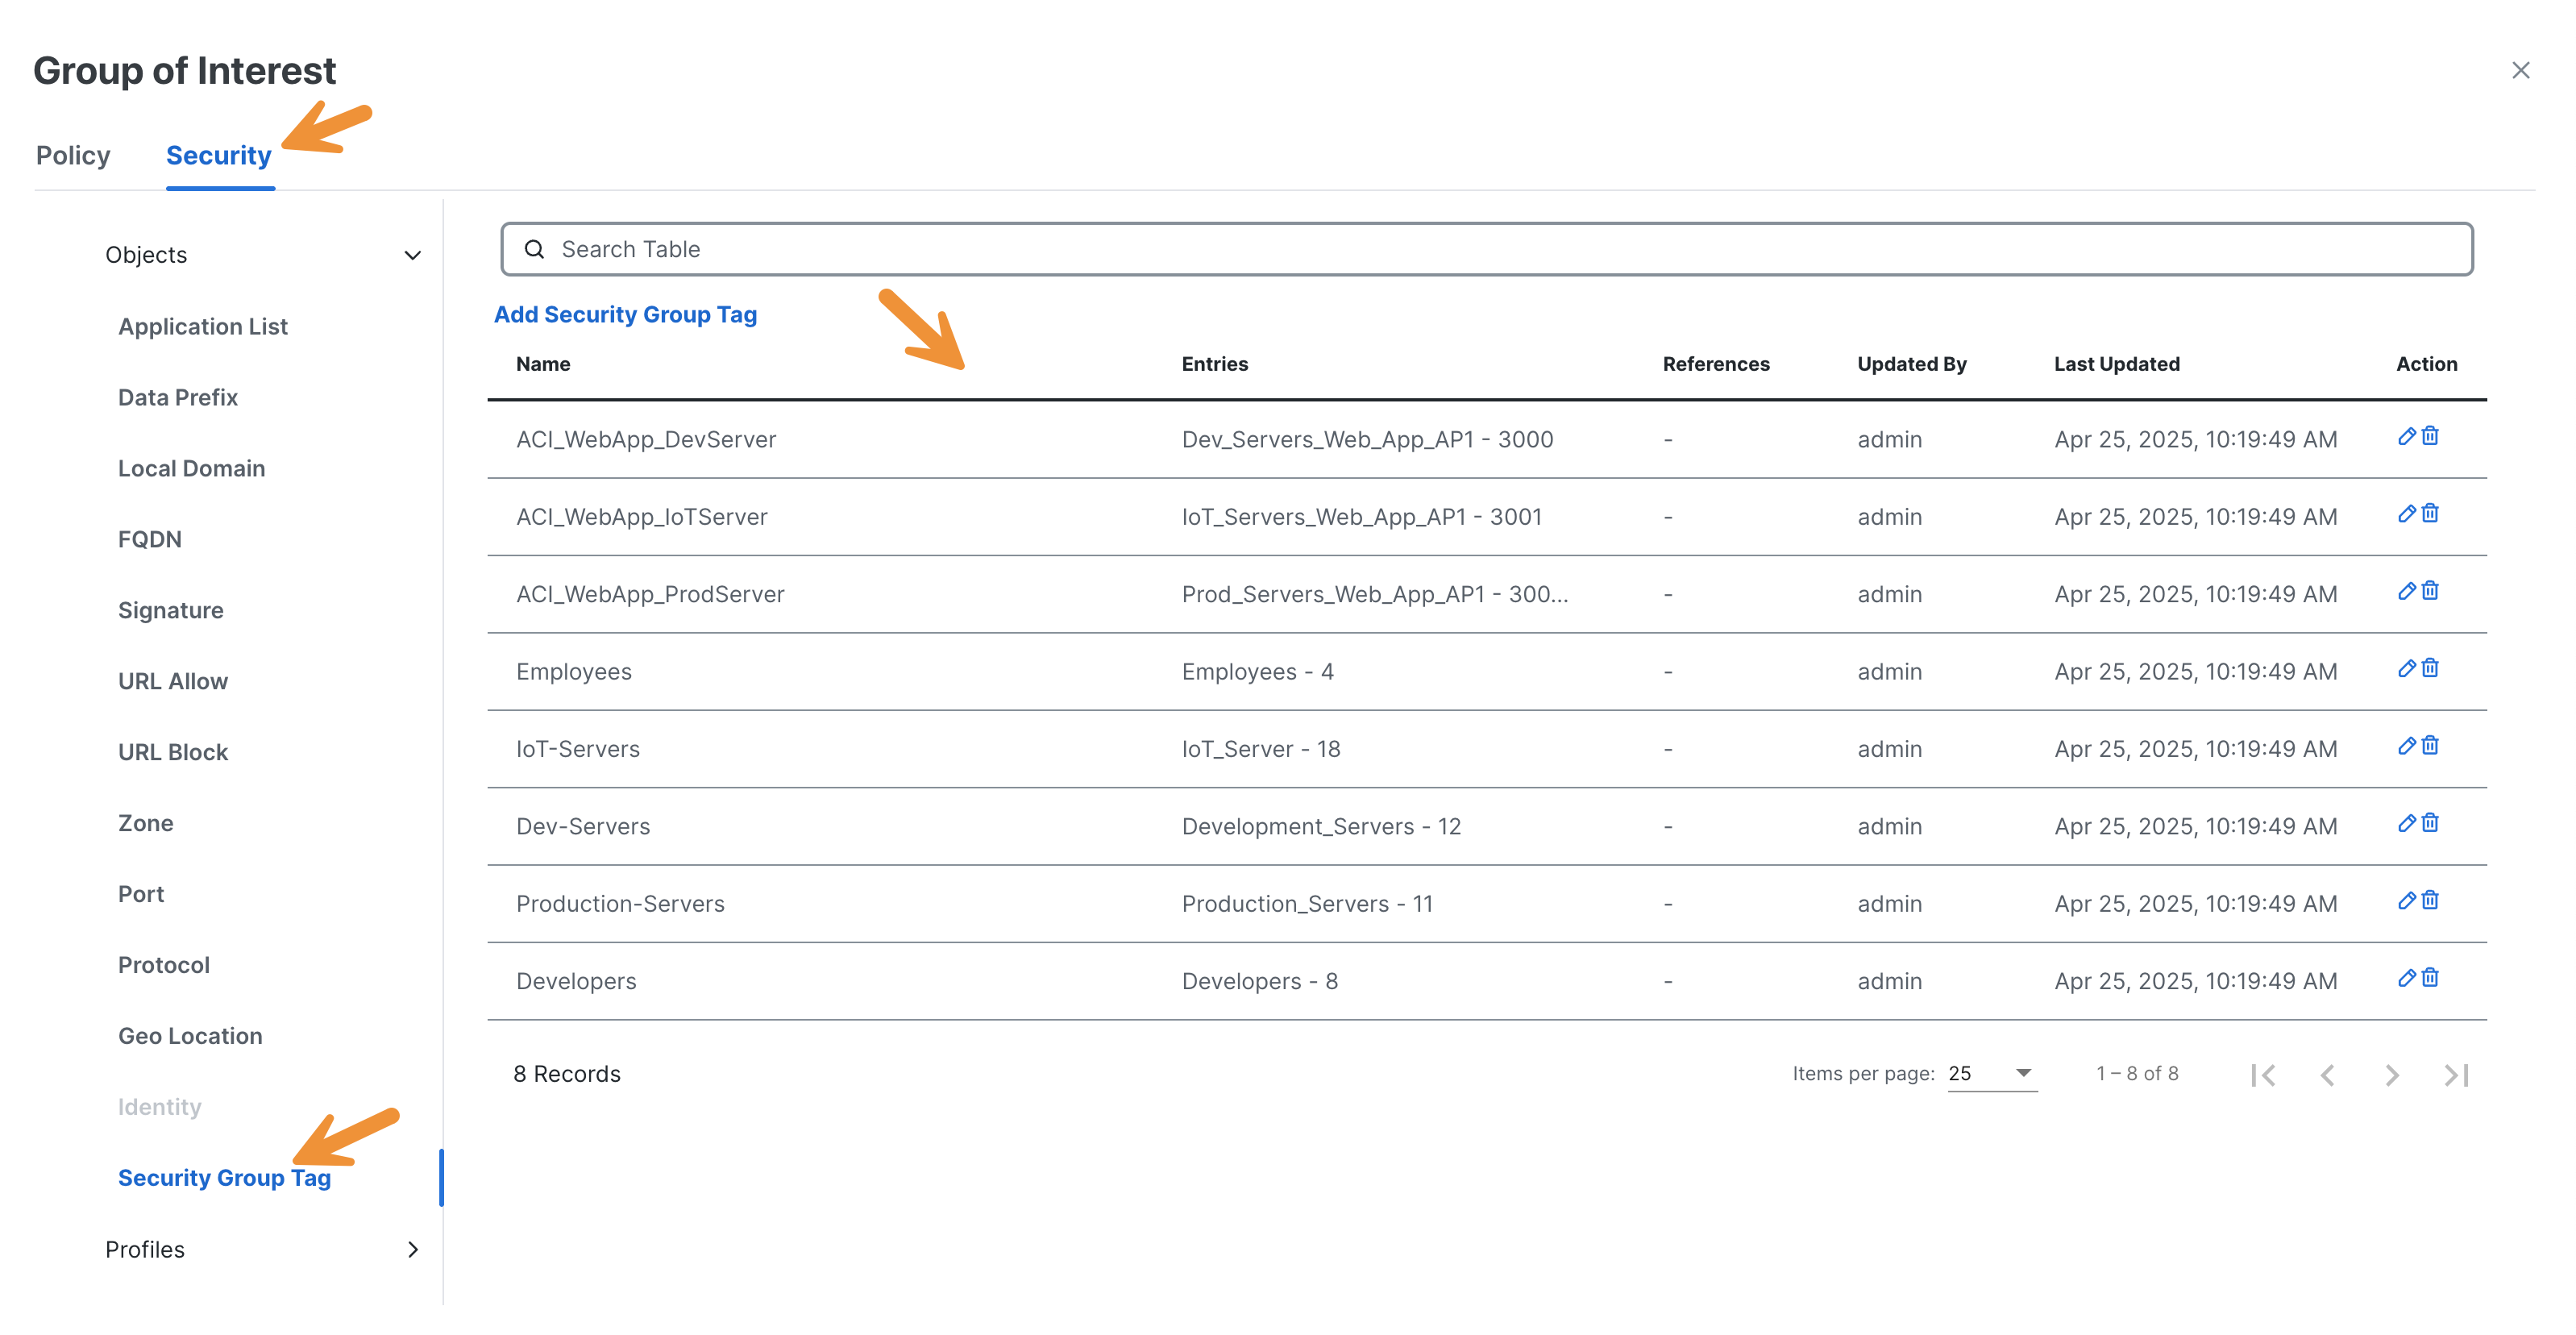
Switch to the Security tab at the top of the panel, then click on the Security Group Tag towards the bottom of the left-hand list. Take notice that the SGTs used in policy rules have been mapped to names for use in the rules.
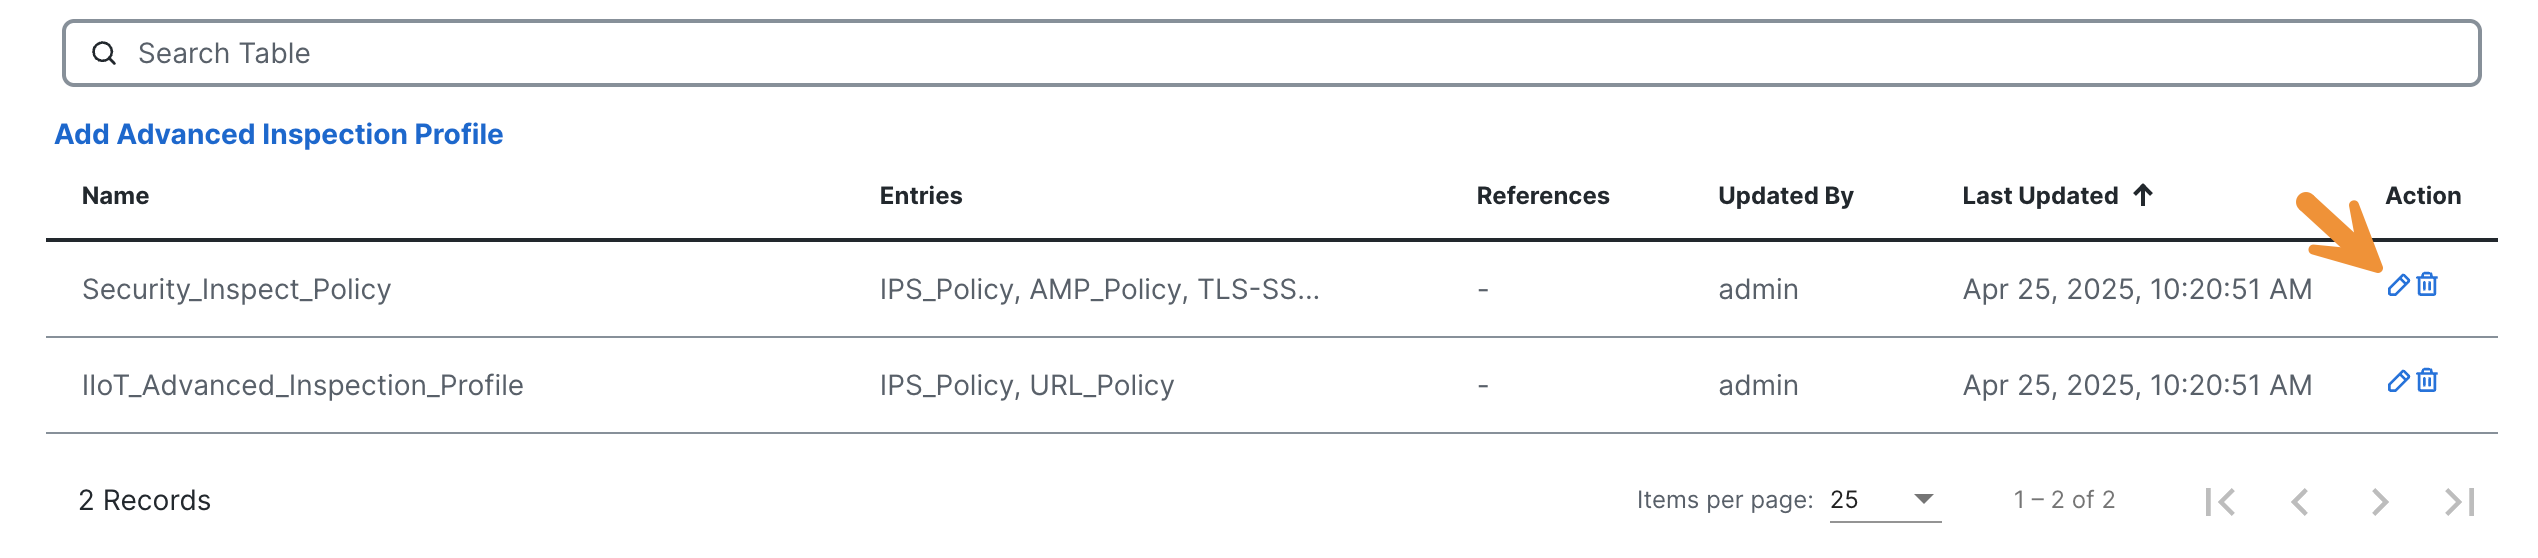
Next, expand the Profiles section located at the bottom of the left-hand list. Afterward, select the Advanced Inspection Profile.
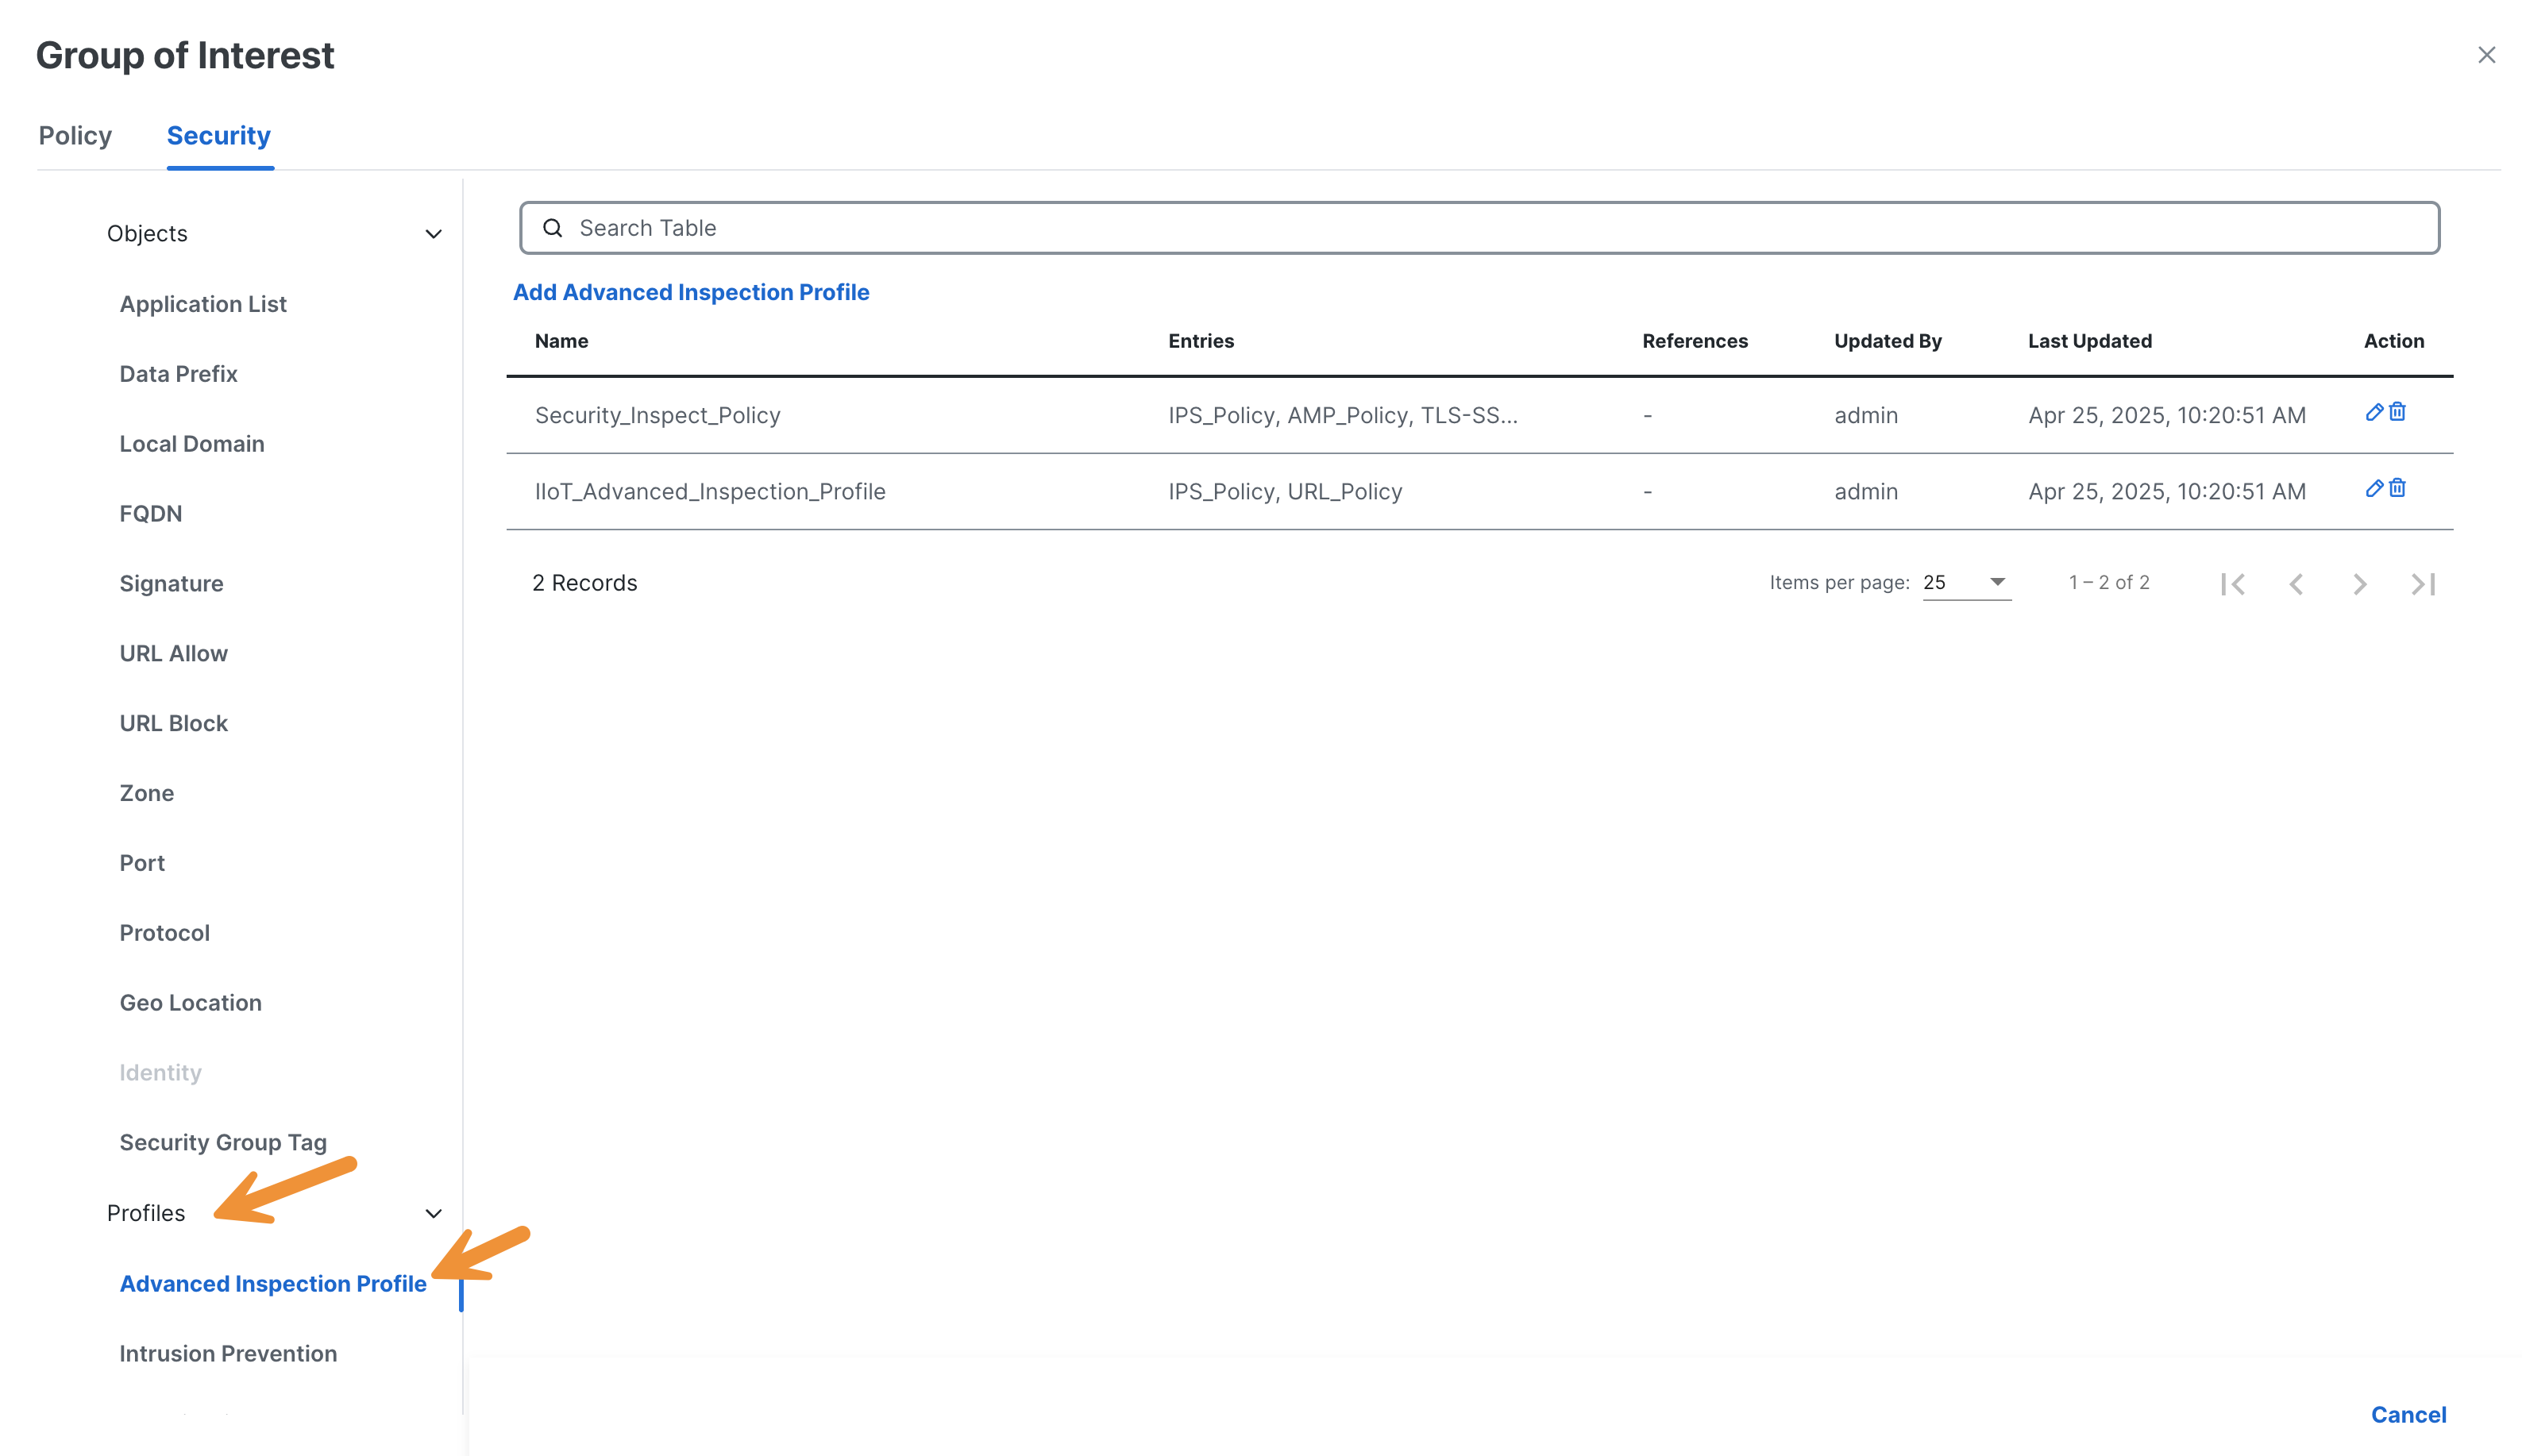
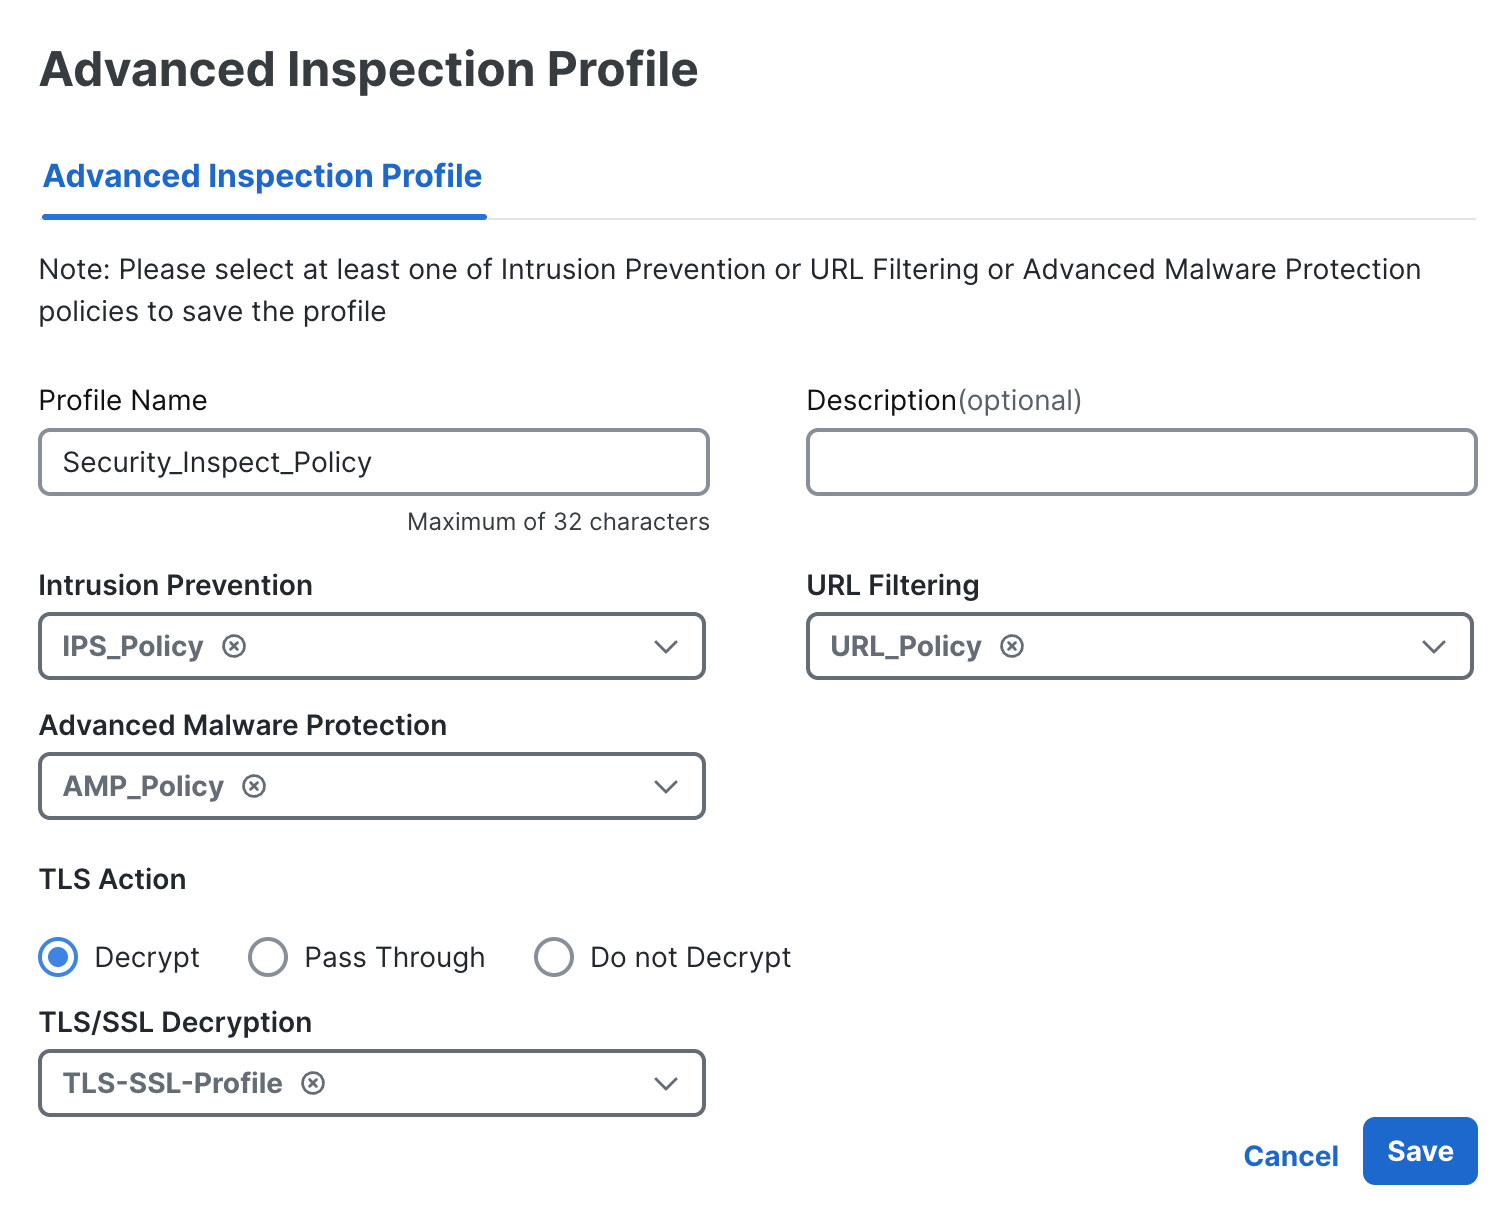
Click on the blue pencil icon to review the Security_Inspect_Policy policy.
In the pop-up window, AMP, IPS, and URL filtering have been enabled. This profile is where the various UTD engine components converge to be applied to a given embed security policy. Please click Cancel at the bottom right after reviewing.
Next, select URL Filtering from the list on the left-hand side under Profiles.
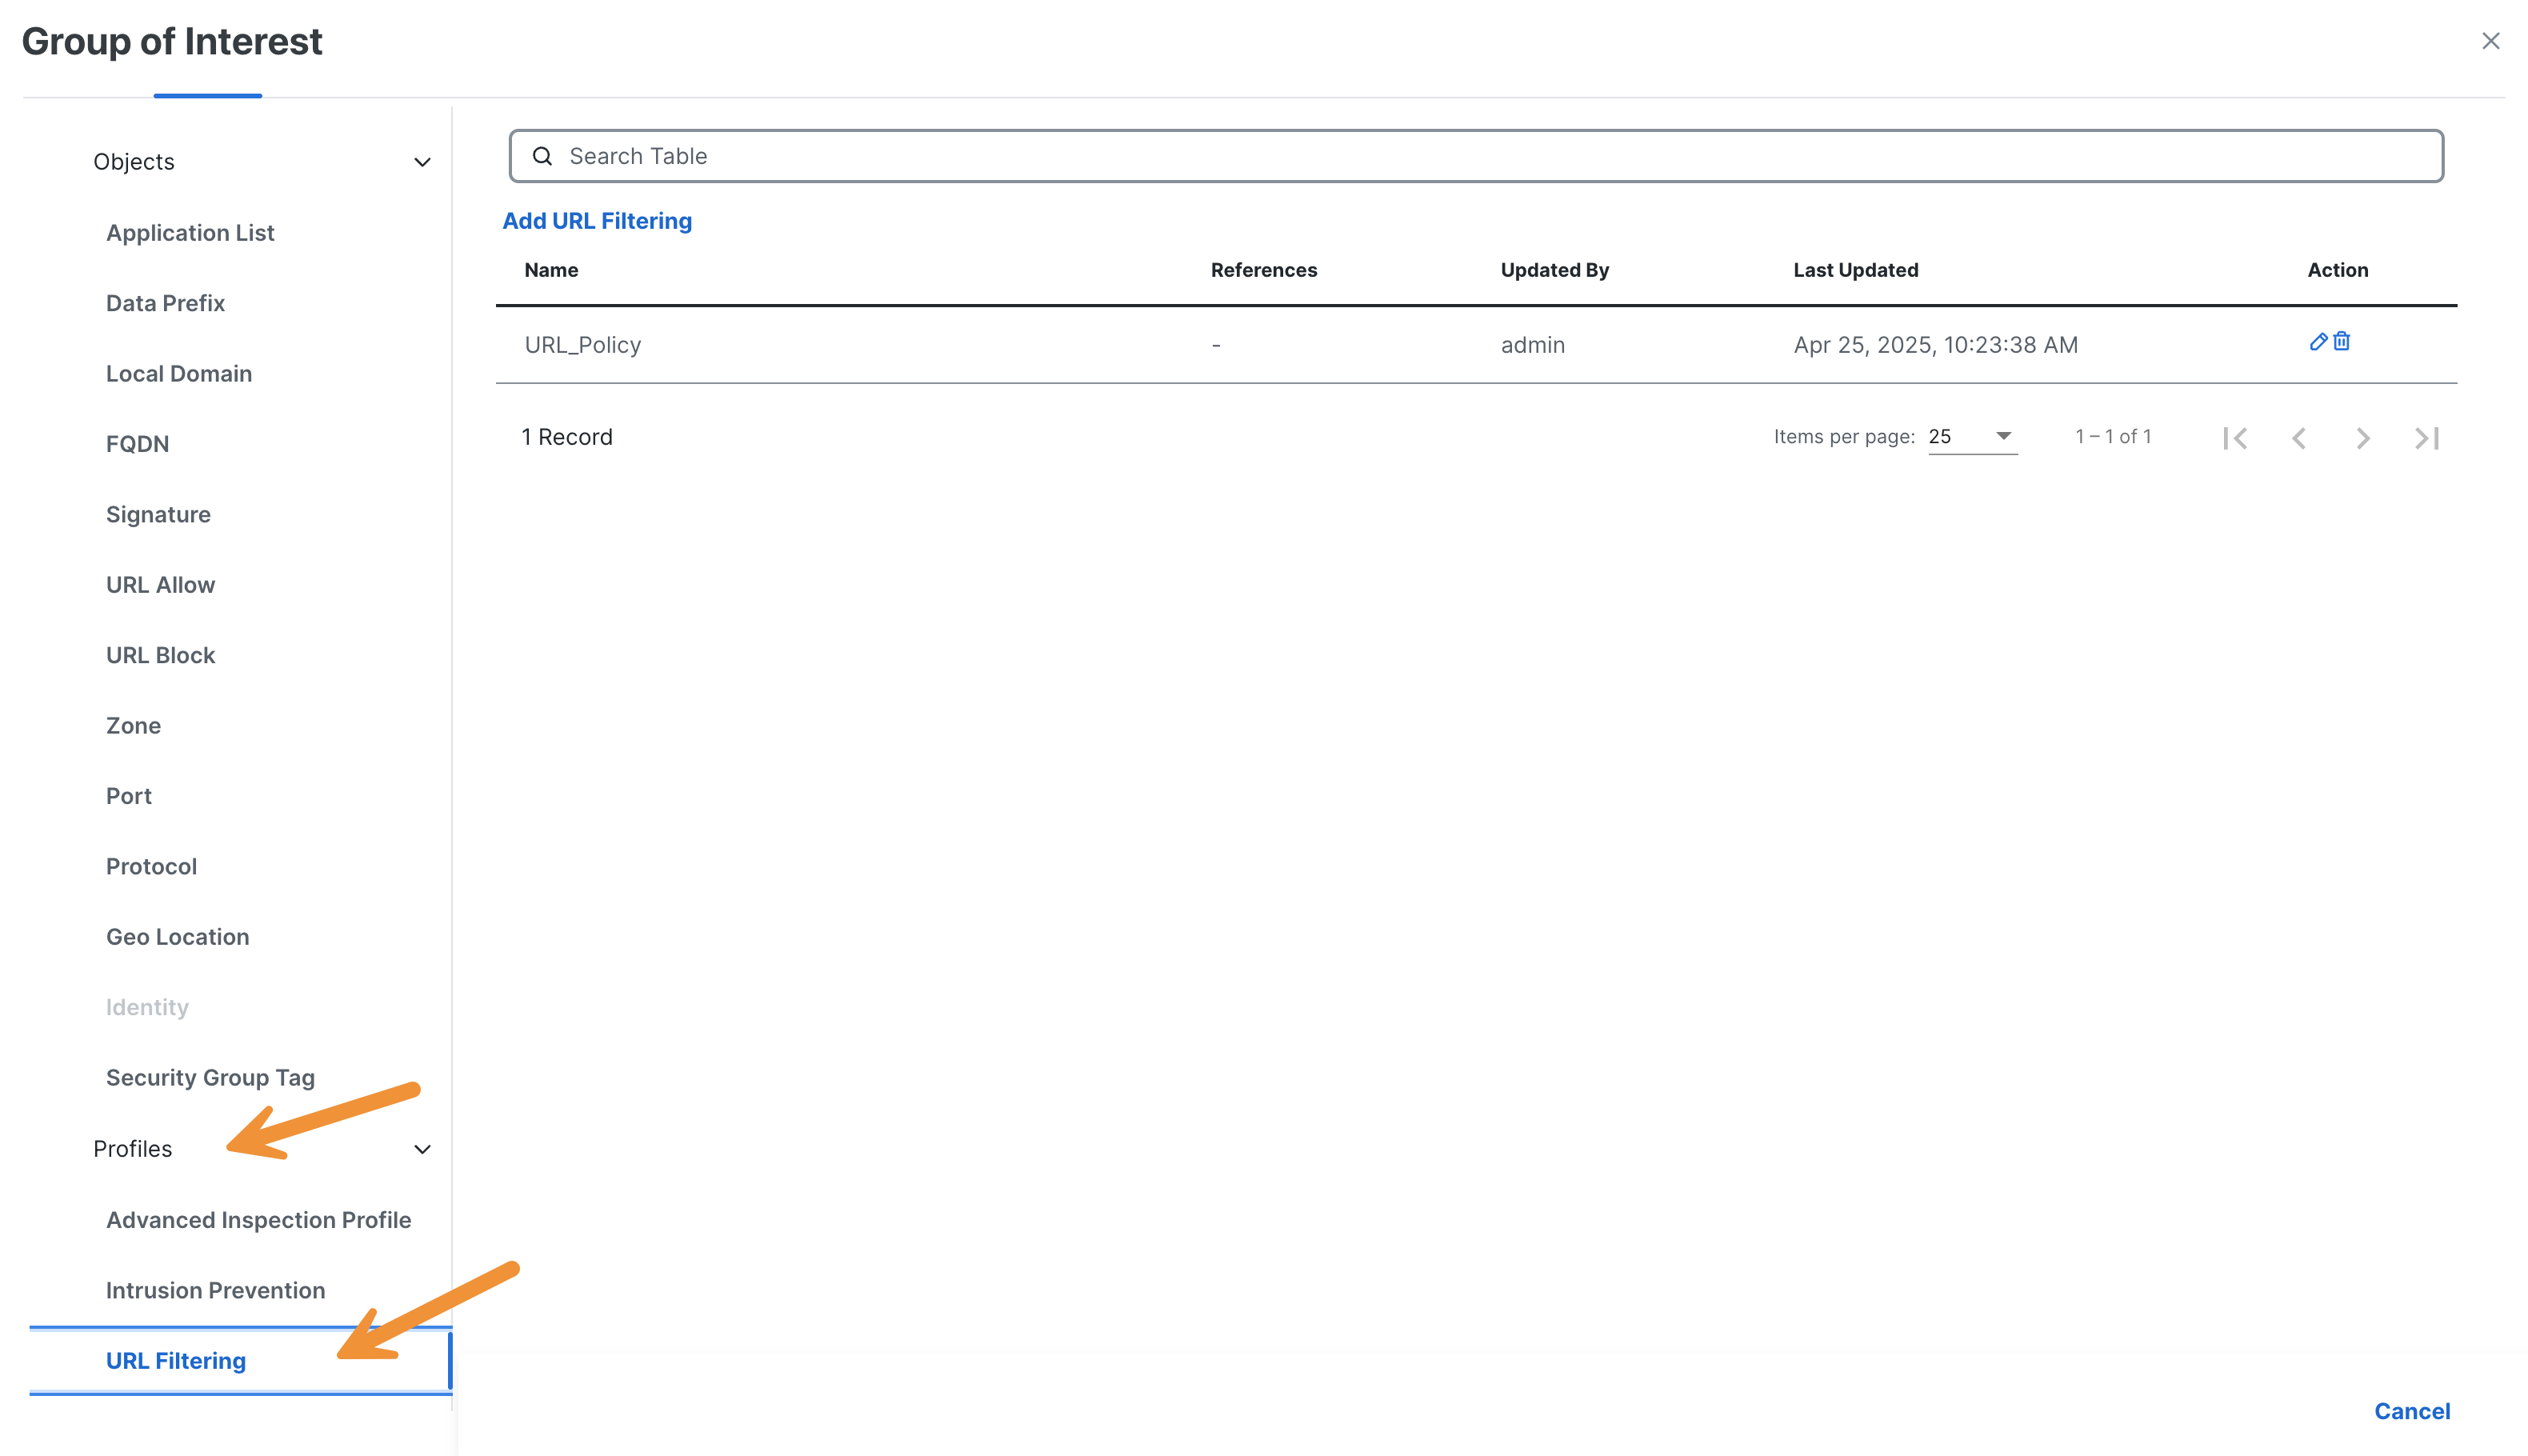
Click on the blue pencil icon to review the configuration settings for URL.
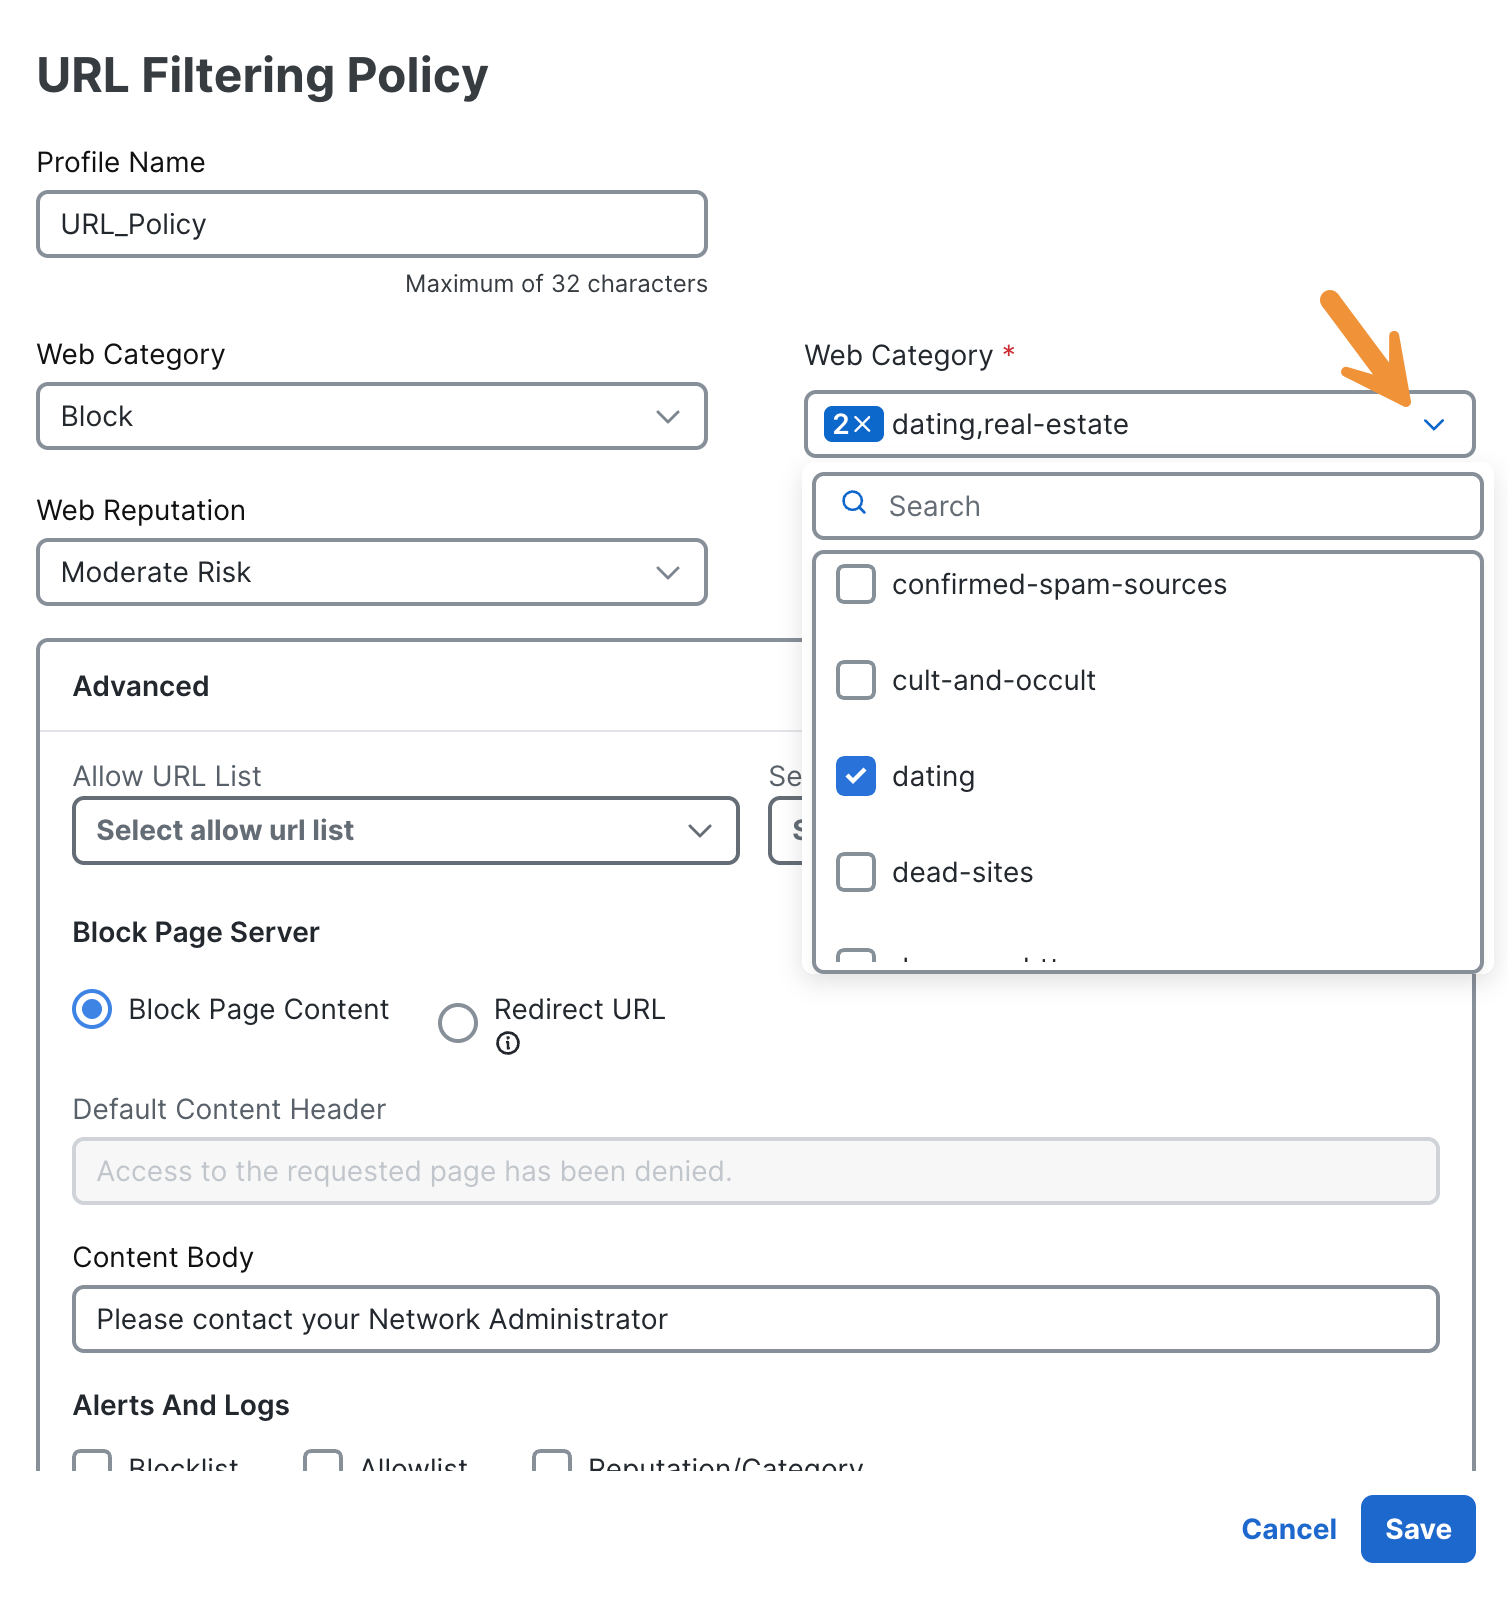
![]()
In the resulting pop-up window, please make note of the available options to limit traffic. One Web Category has already been blocked. Please also take note of the Web Reputation function, which filters domains based on the most up-to-date cloud security data.
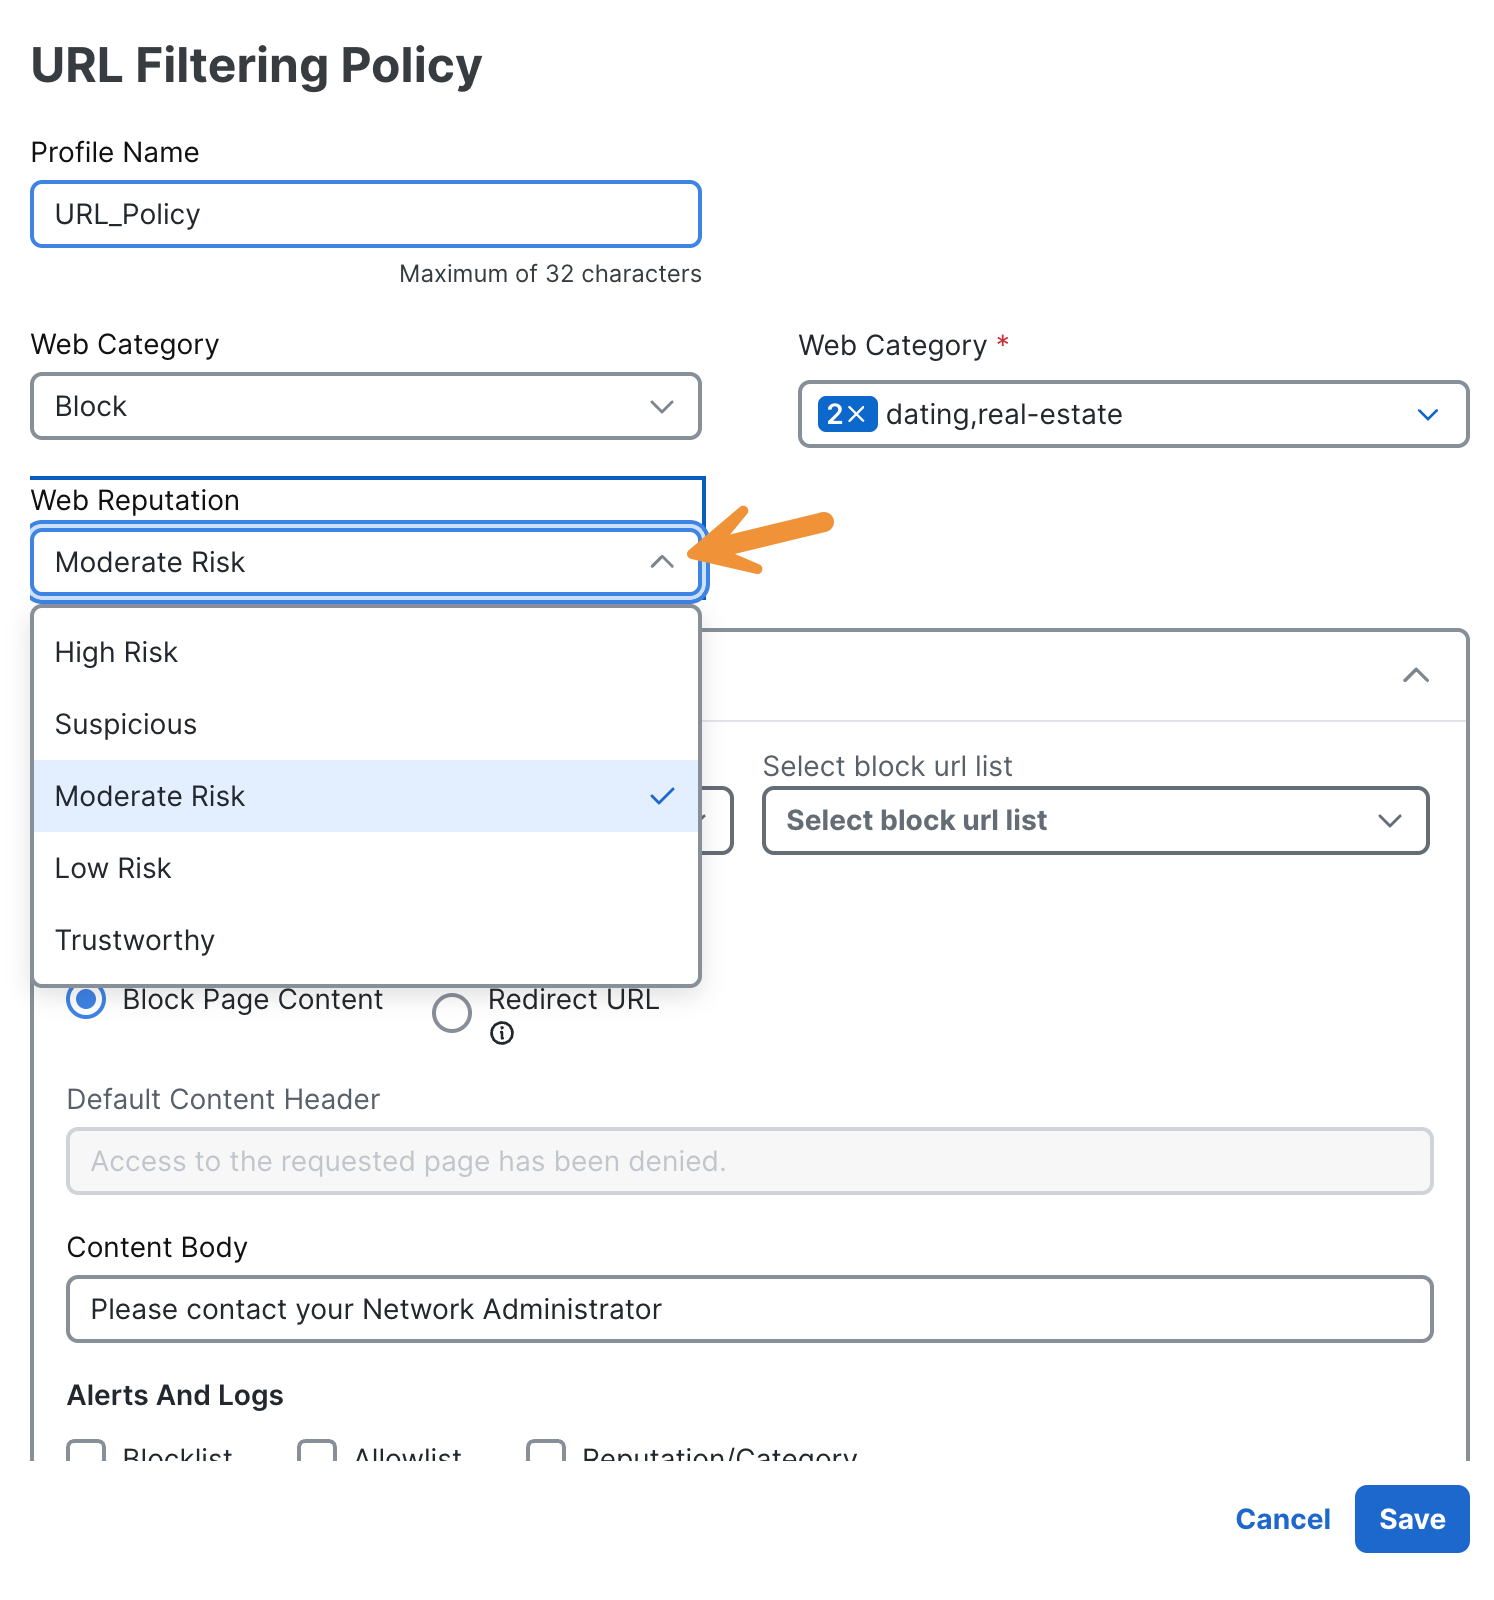
Please click on the Cancel button to close the URL filtering profile after you have reviewed it.
Next, select Intrusion Prevention from the list on the left-hand side under Profiles.
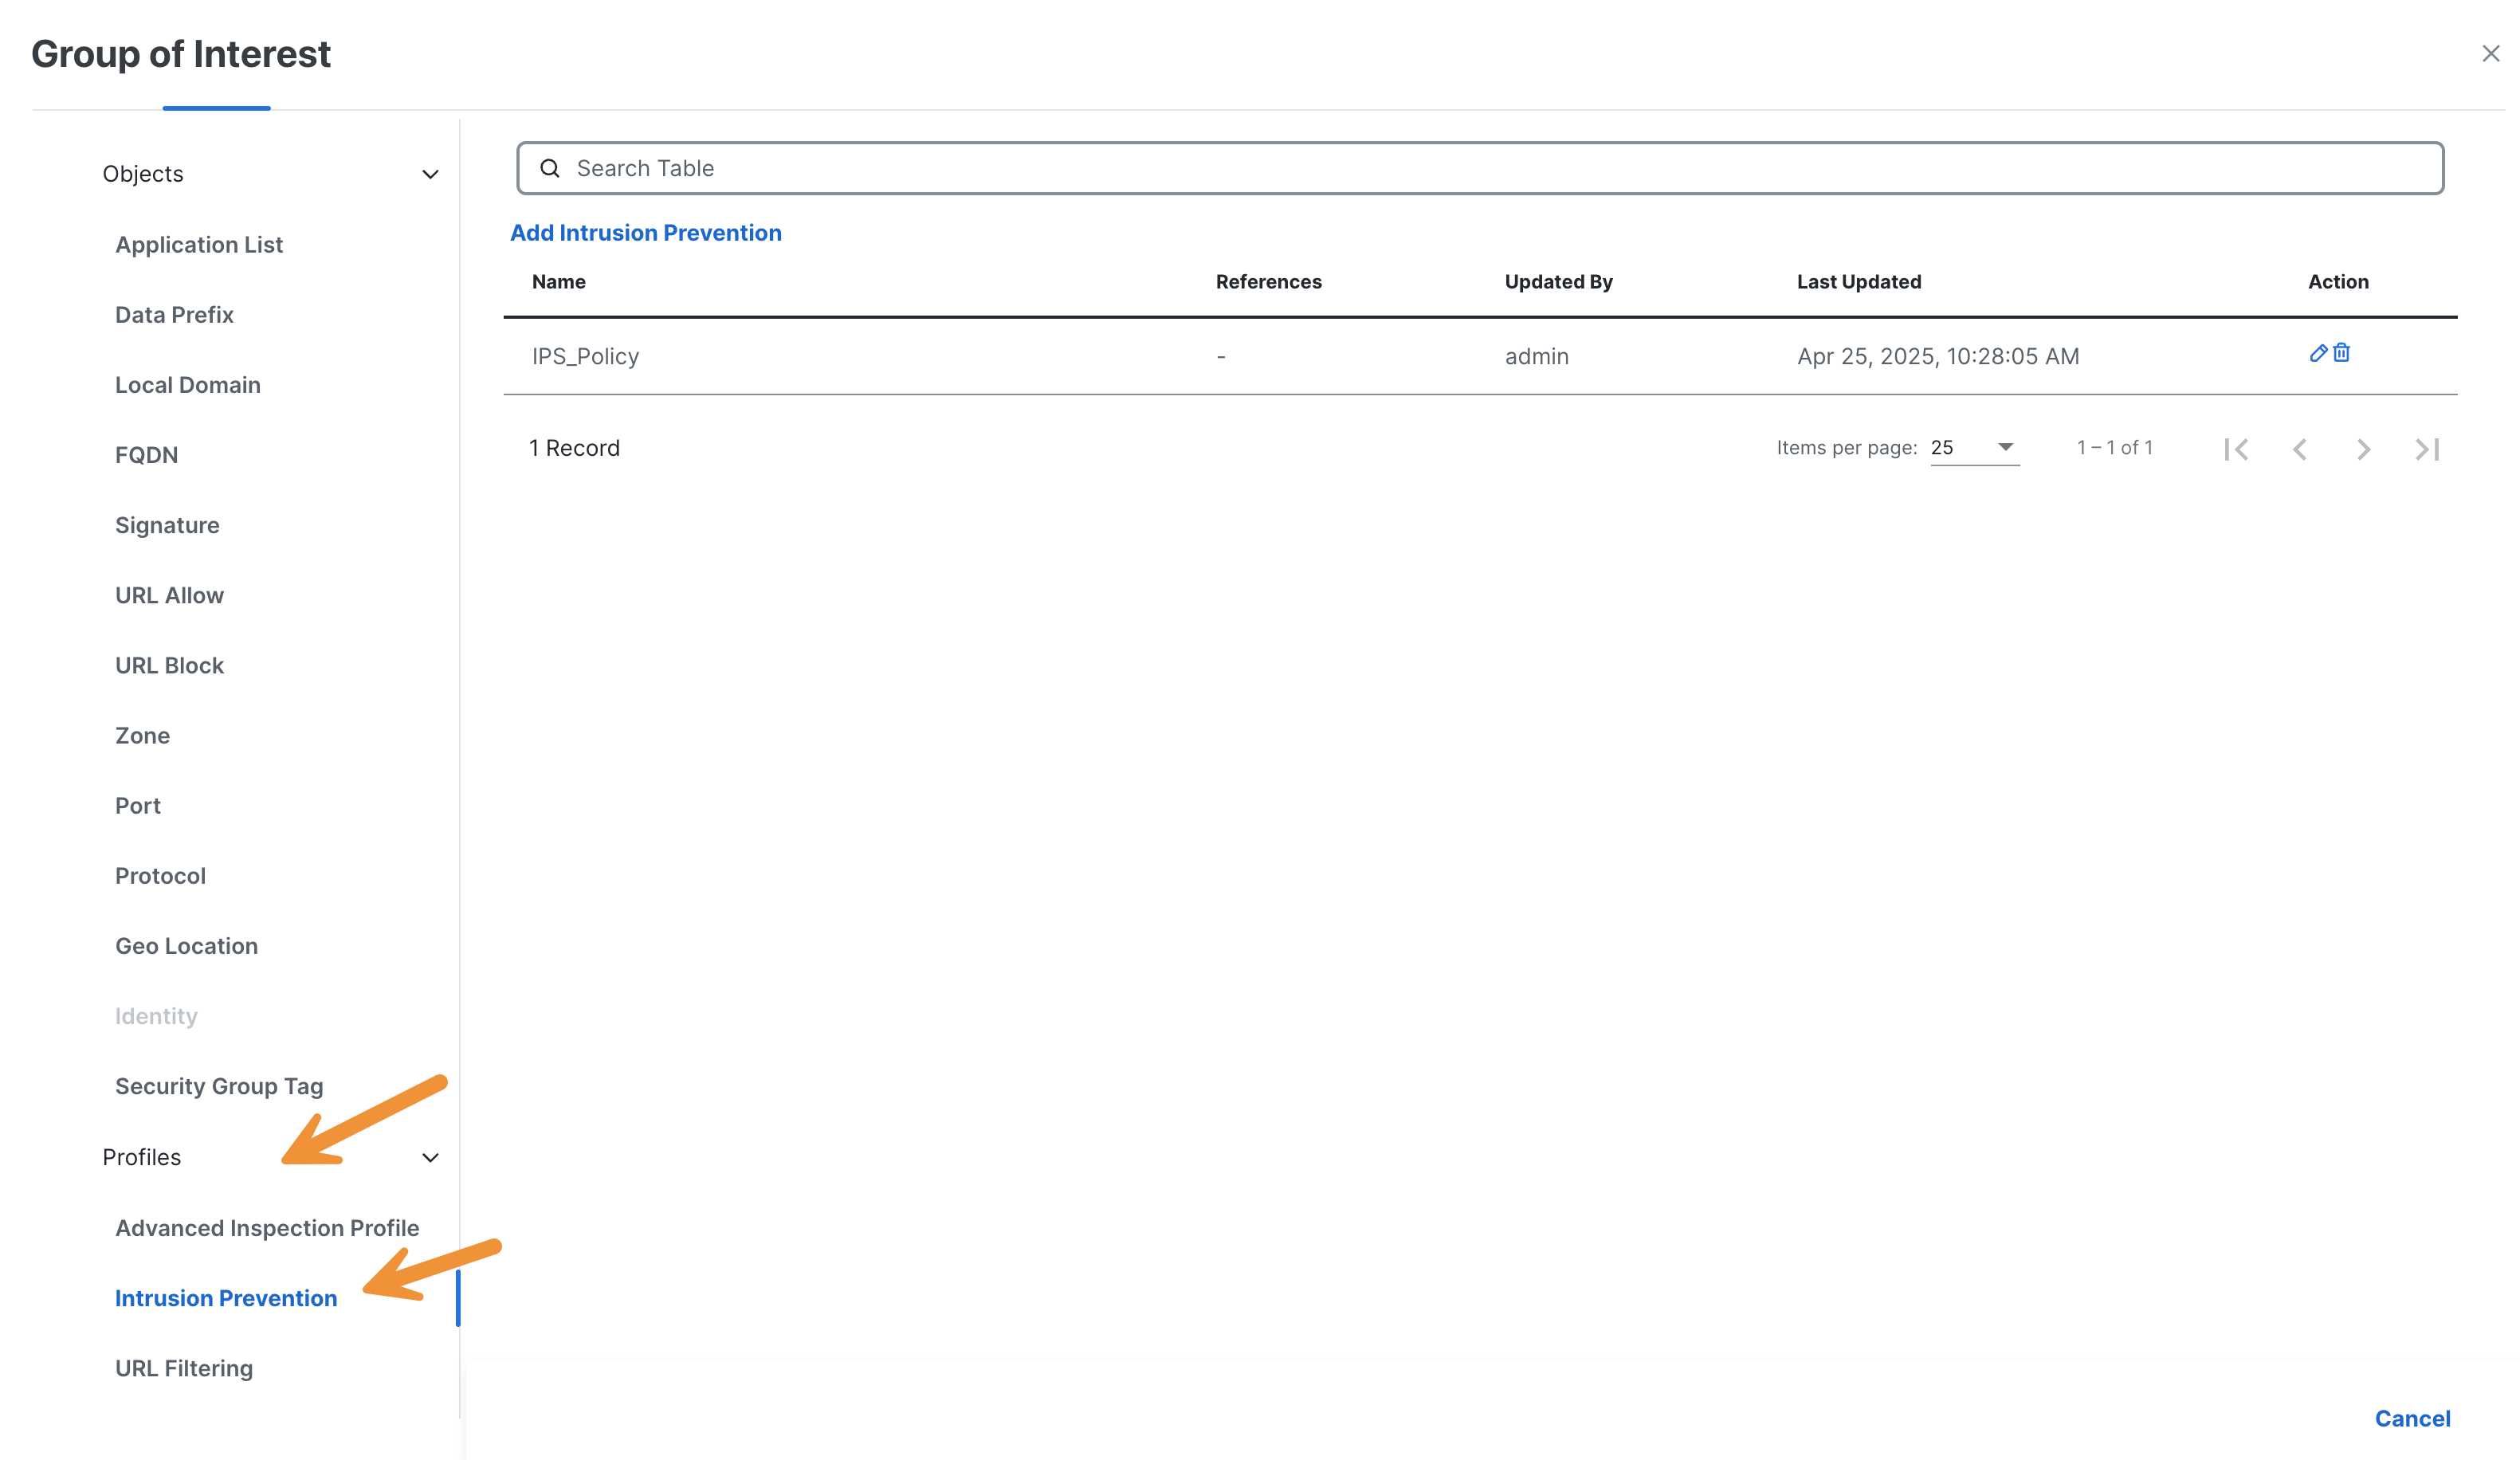
Click on the blue pencil icon to review the configuration settings for IPS.
![]()
In the resulting pop-up window, please take note of the available options to inspect traffic. Please make note of the Custom Signature Set option, which allows for the utilization of customized filters.
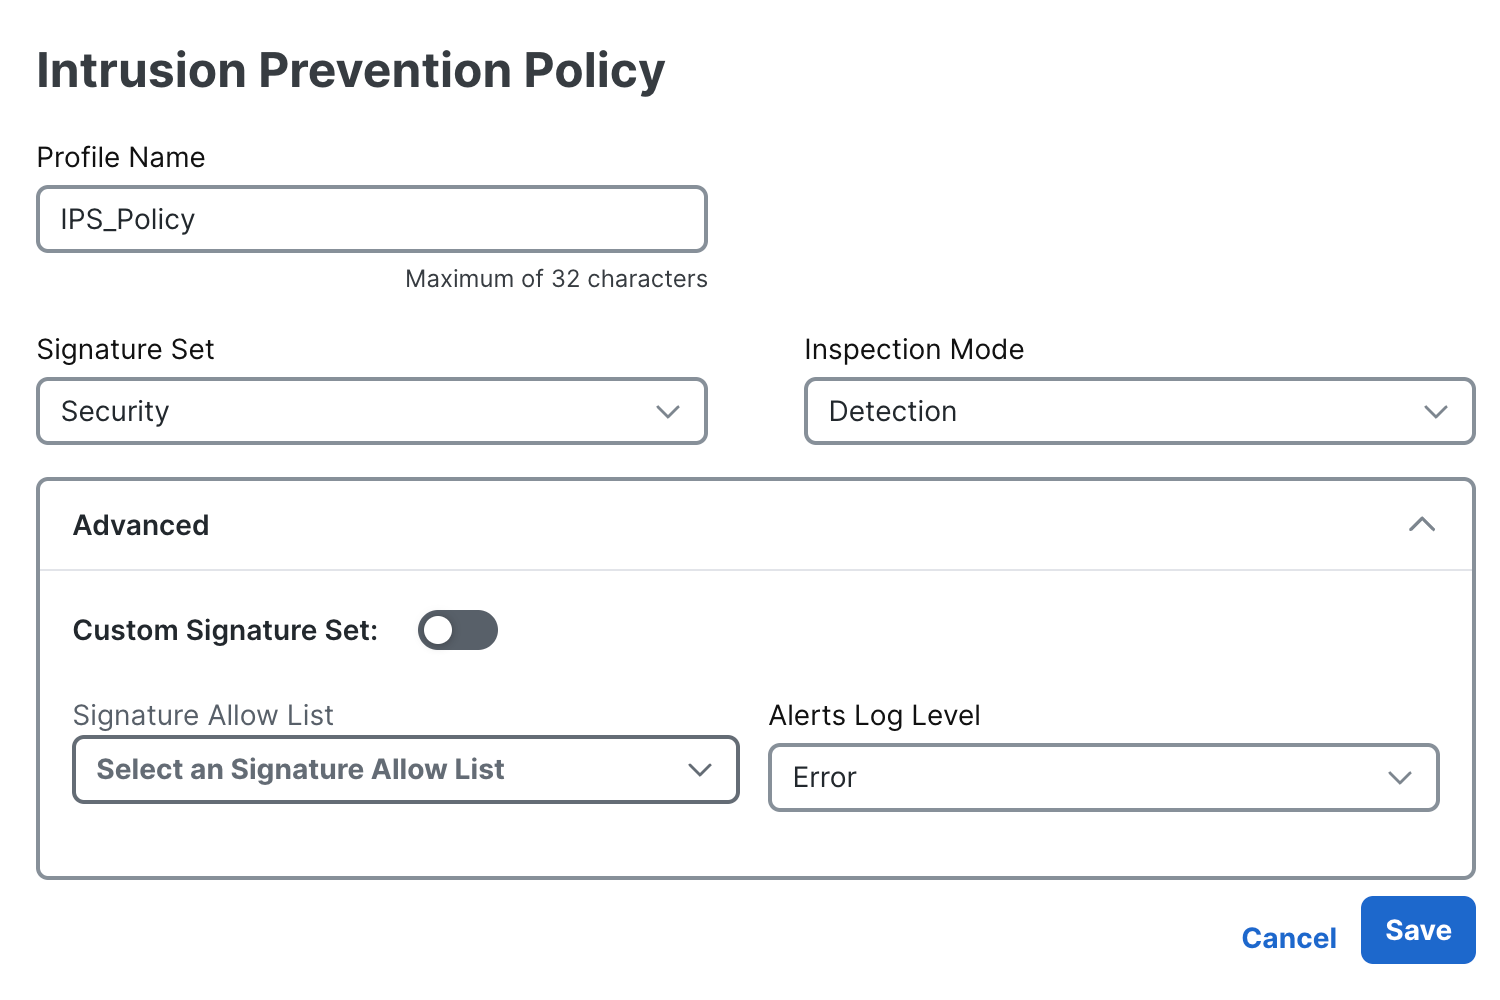
Please click on the Cancel button to close the IPS profile after you have reviewed it.
Next, select Advanced Malware Protection from the list on the left-hand side under Profiles.
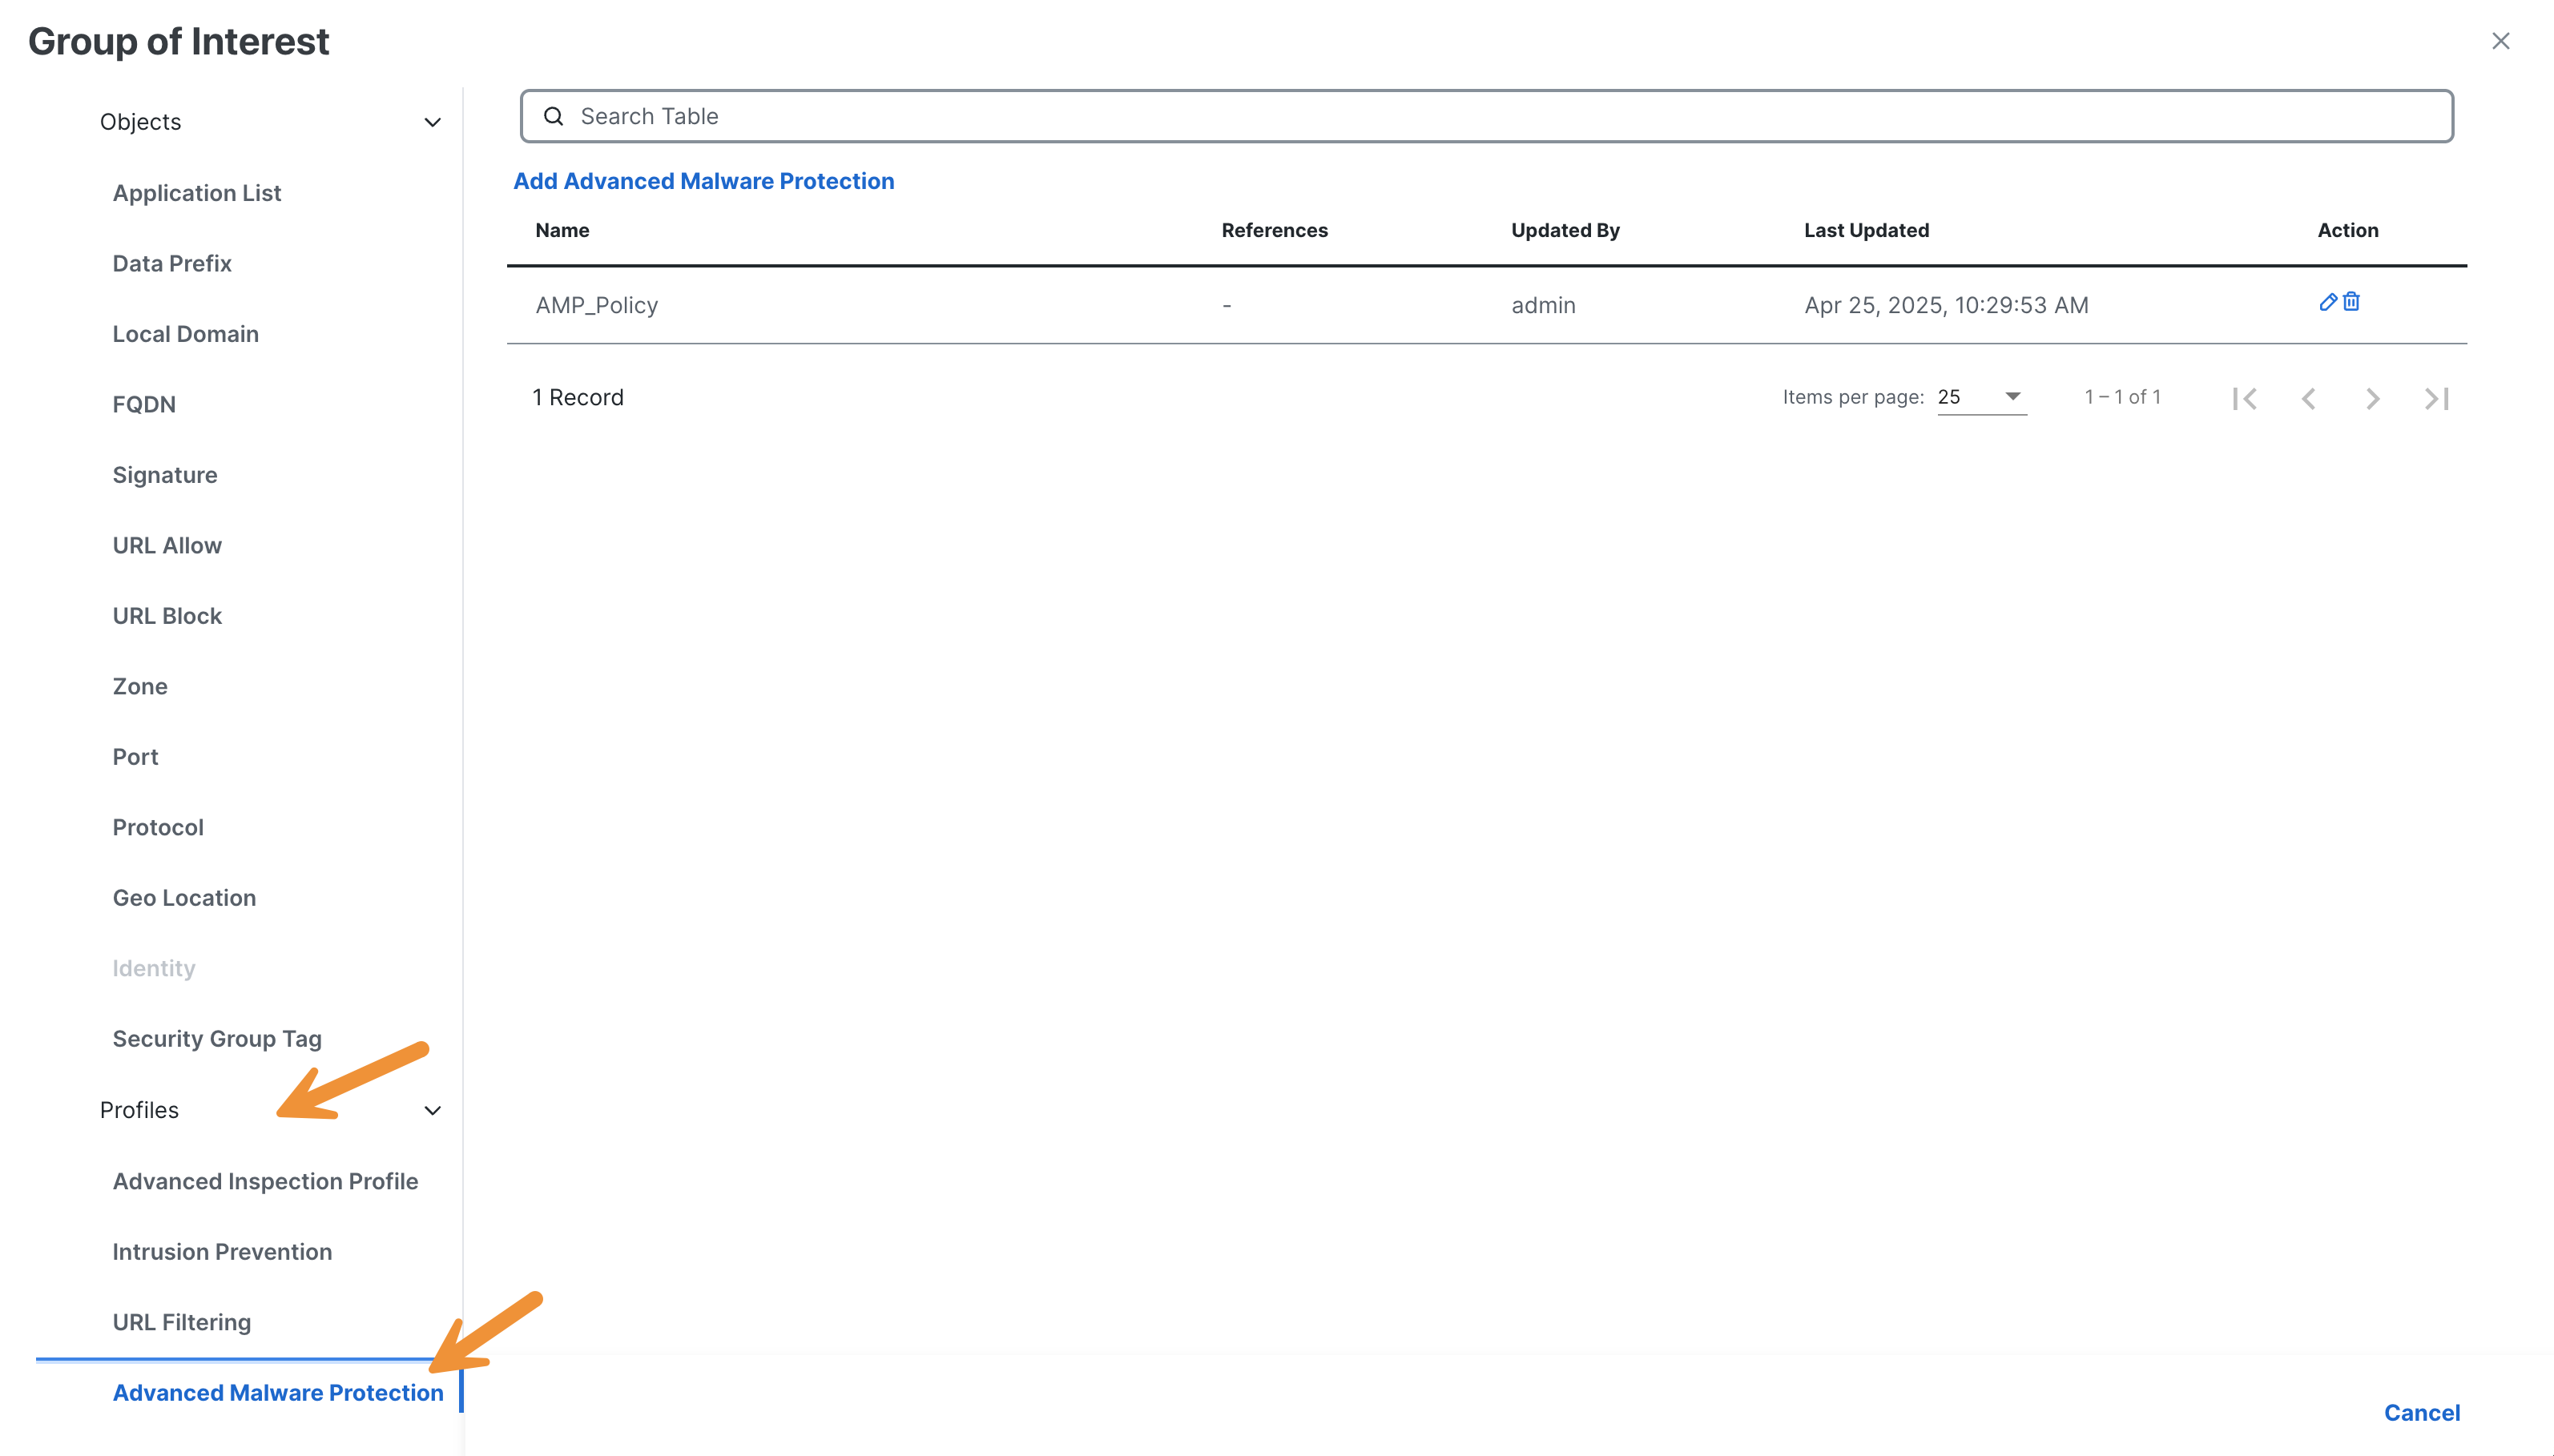
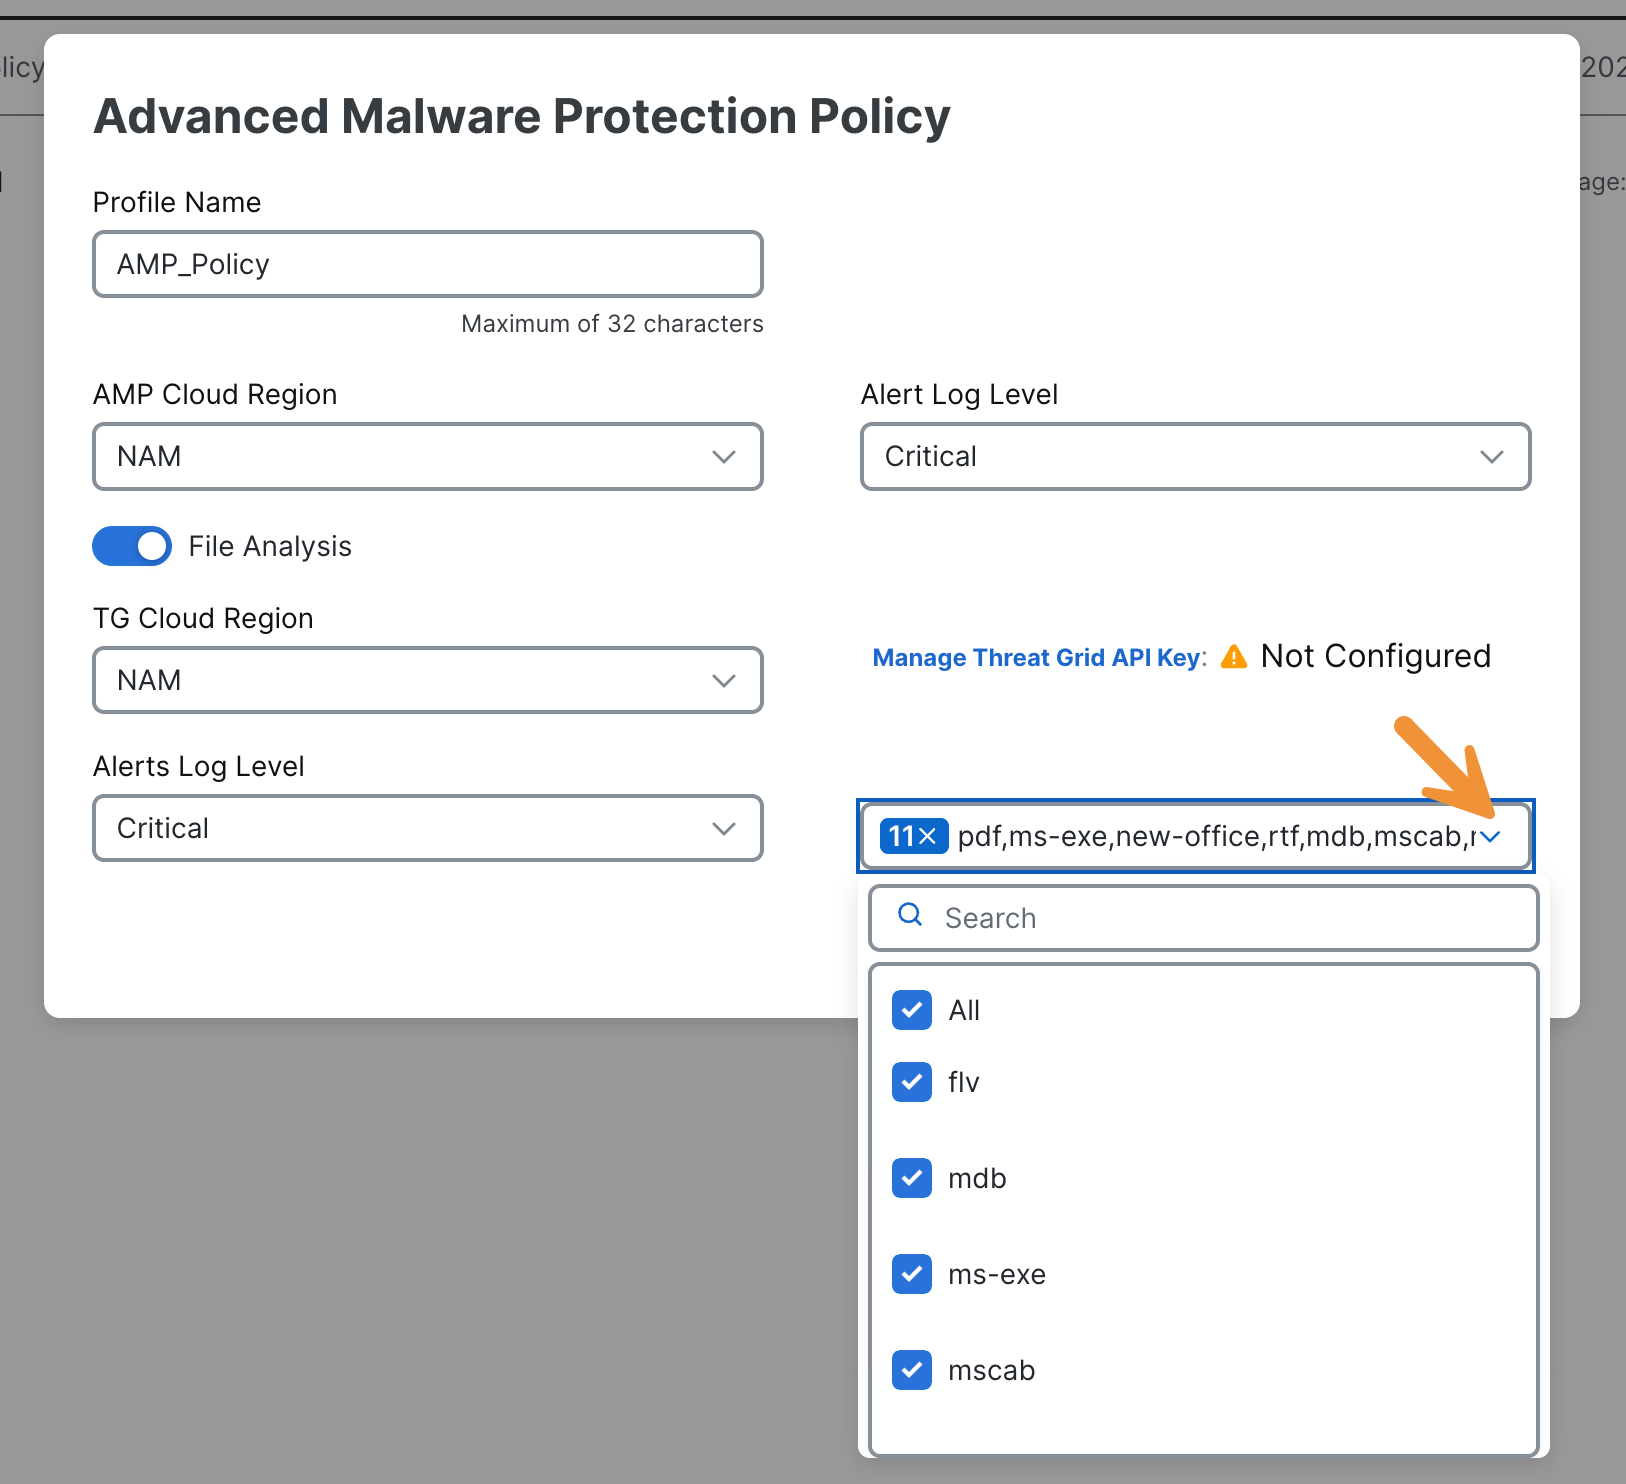
Click on the blue pencil icon to review the configuration settings for AMP.
![]()
In the resulting pop-up window, please take note of the available options for inspecting traffic. Please make note of the file types menu (at the bottom right corner).
Please click on the Cancel button to close the AMP profile and close the slide-out panel to return to the Policy Groups section.
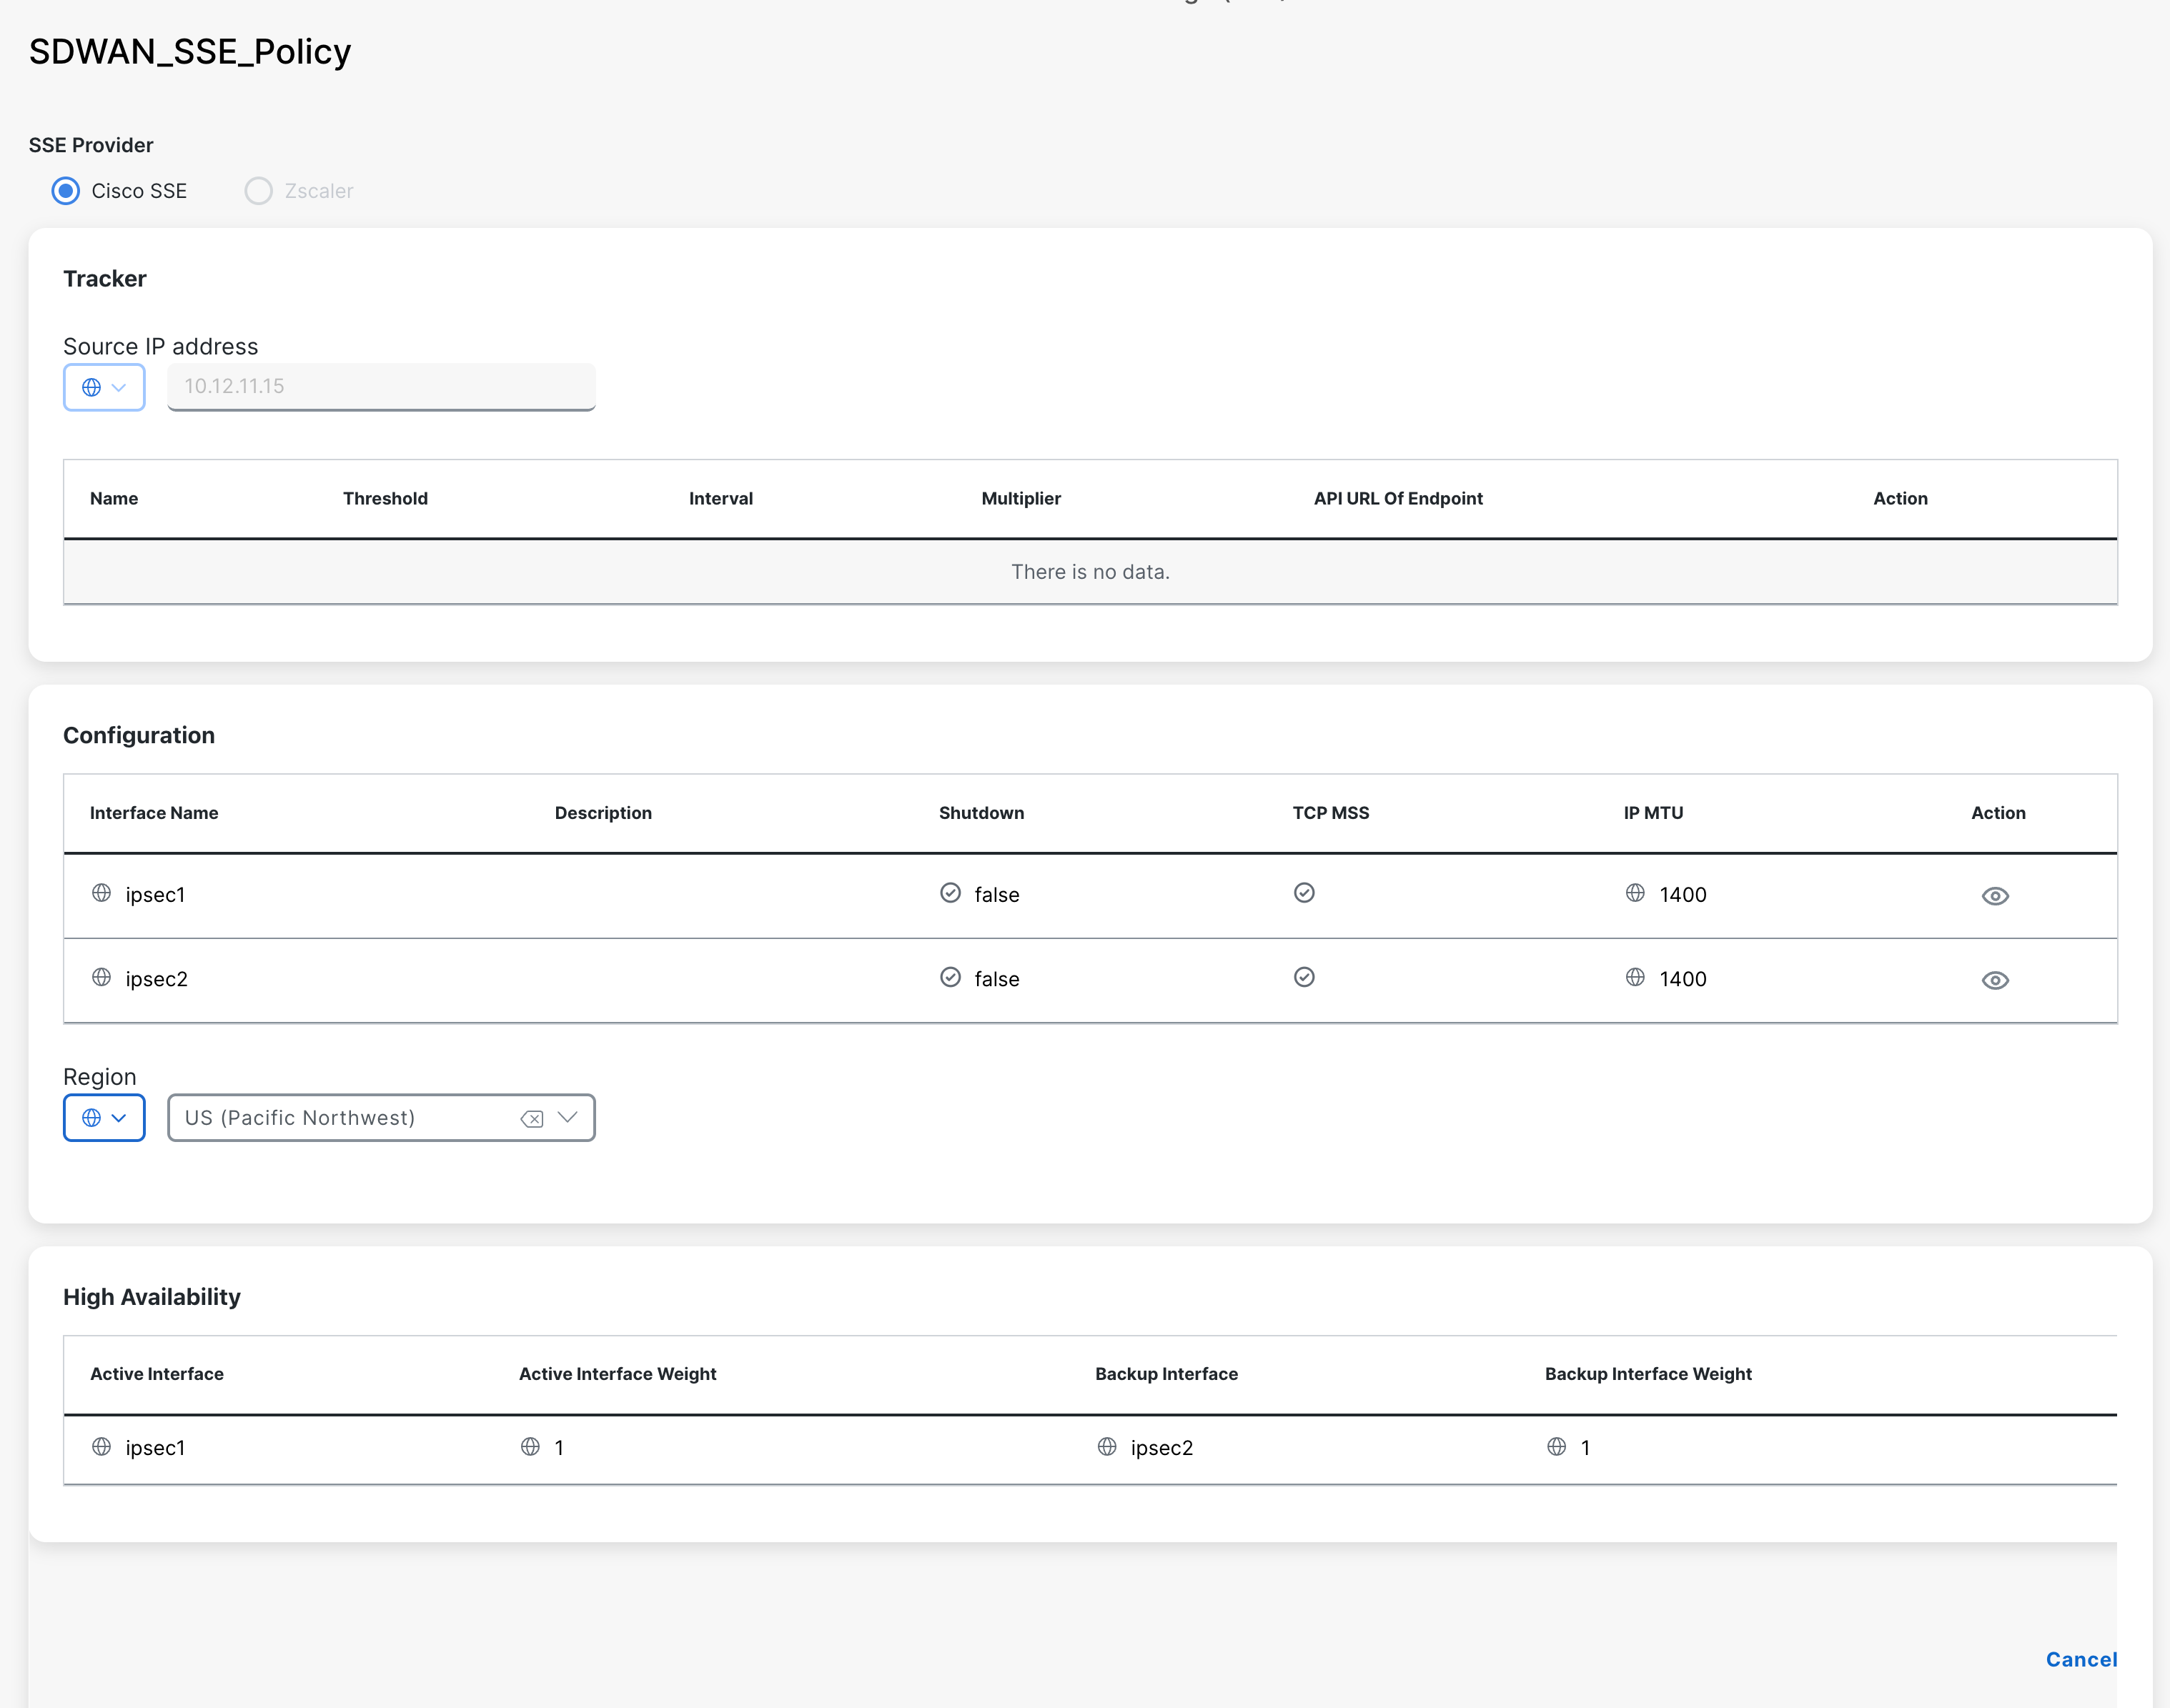
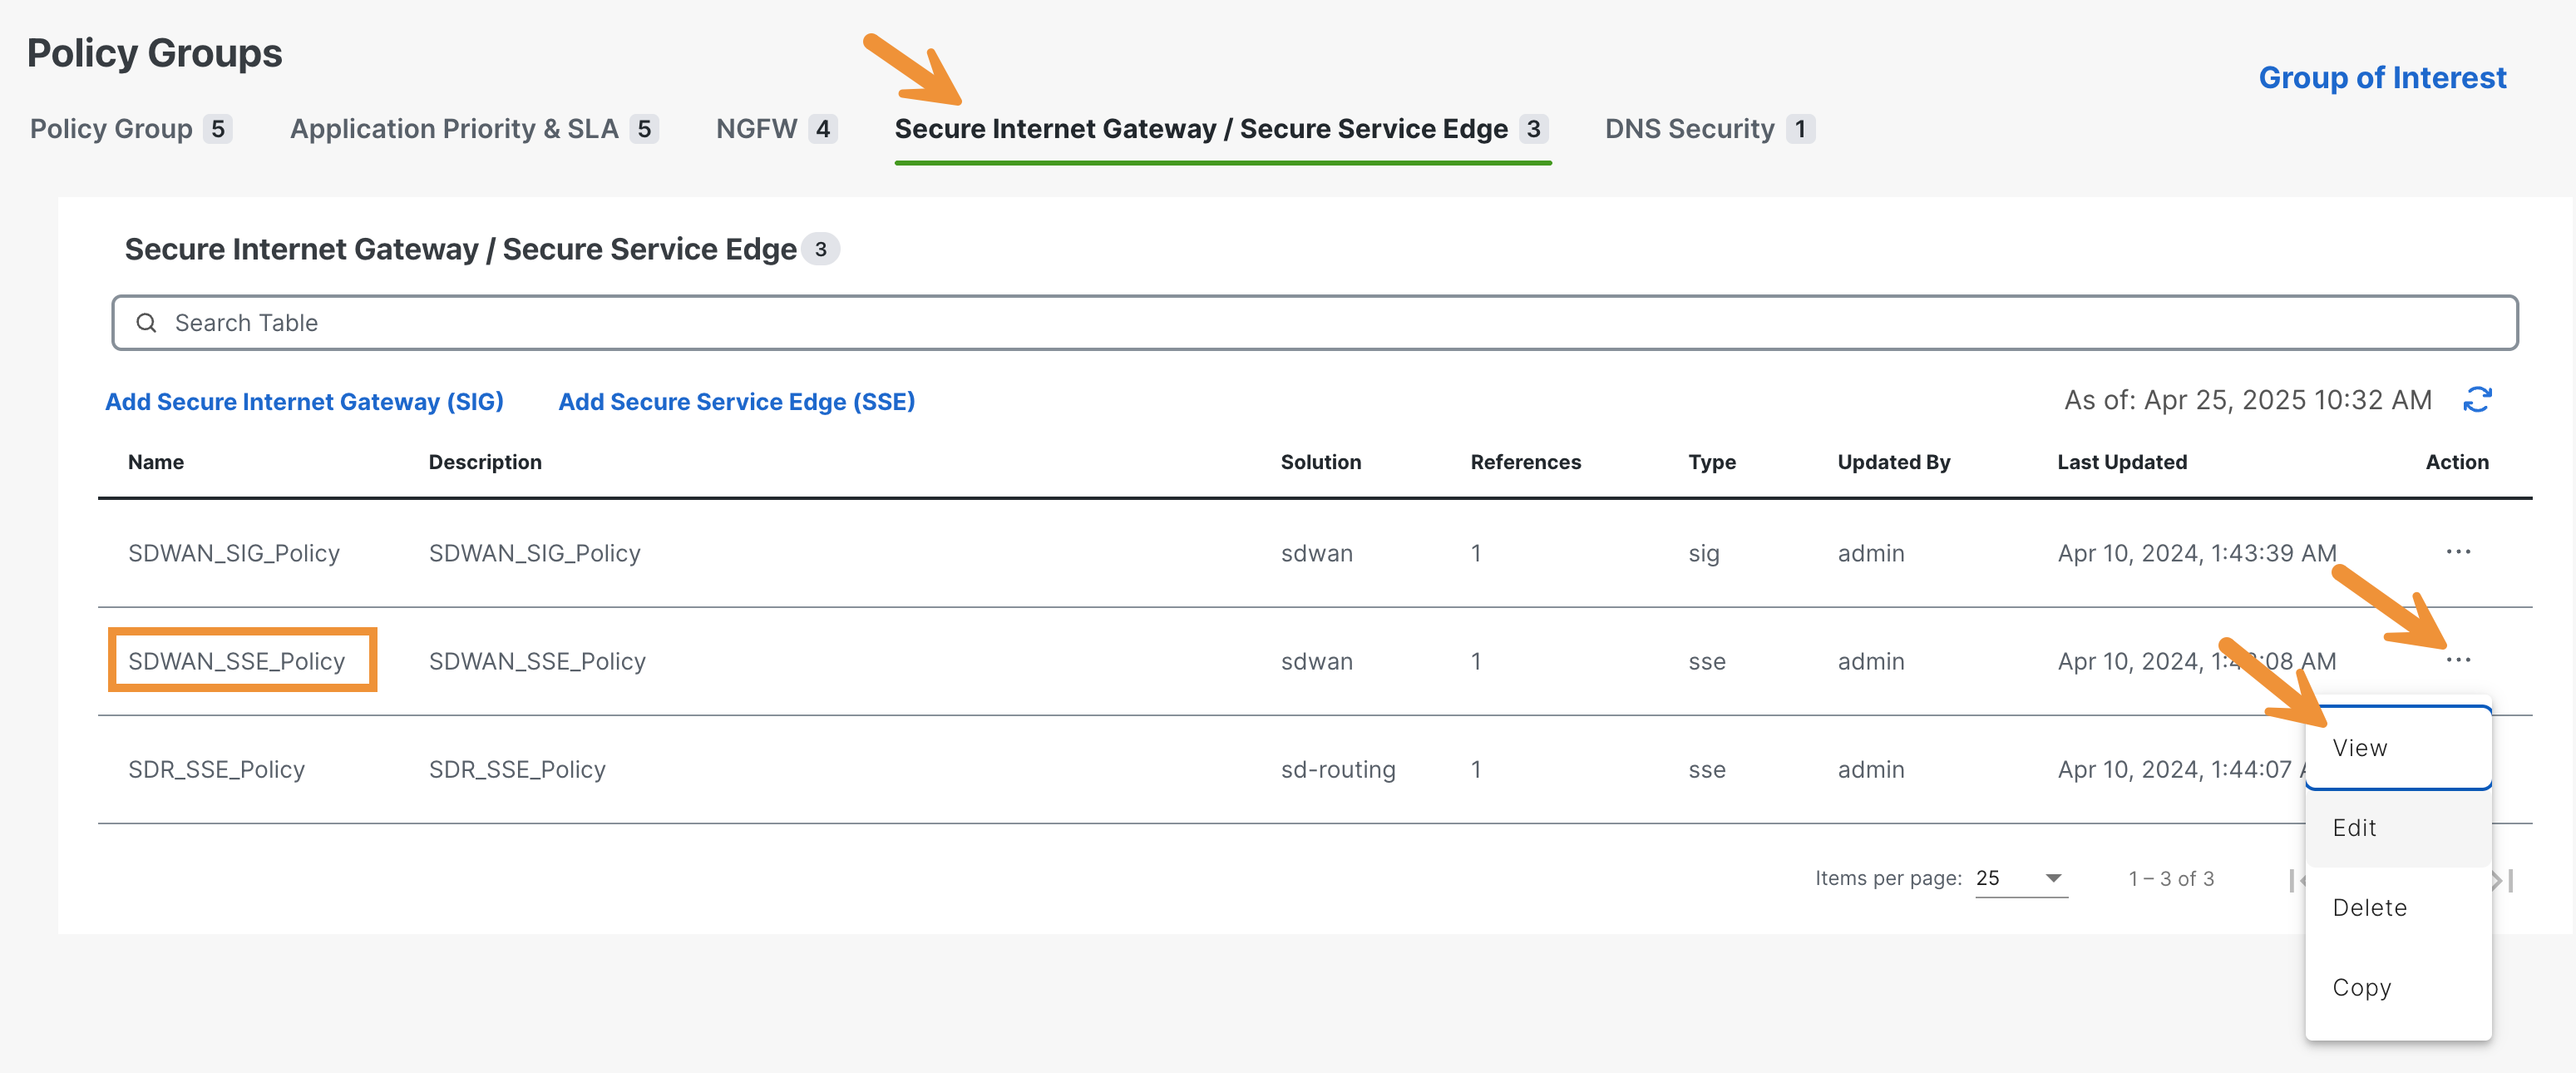
Click on the Secure Internet Gateway / Secure Service Edge tab. Next, click on the three dots for the SDWAN_SSE_Policy and select View. This is the policy currently being used for the MXC branch.
Review the options. Cisco SSE is the provider, two tunnels have been set up for high-availability, and a Data Center has been manually configured (US Pacific Northwest).